Operational Efficiency Metrics Your Rental Business Needs
Boost your rental's profitability by tracking the right operational efficiency metrics. Learn to measure turnaround time, RevPAR, support load, and more.
You can spend an entire day “working on the business” and still have no idea whether the work improved it. A cleaner ran late. A guest asked for the Wi-Fi code again. Someone couldn't find the parking instructions. You approved a refund, reordered supplies, answered messages at dinner, and ended the day feeling productive.
Then you look at your payouts and wonder why the effort doesn't feel matched by the profit.
That gap is where operational efficiency metrics matter. They turn a rental business from a pile of recurring tasks into a system you can manage. Instead of guessing which problem is hurting margins or reviews, you can see it. Instead of solving the same issue over and over, you can fix the process behind it.
Hosts usually don't need more hustle. They need a dashboard that shows where time, money, and guest friction are leaking.
Table of Contents
- From Busy to Profitable The Power of Knowing Your Numbers
- What Are Operational Efficiency Metrics for Rentals
- The 7 Essential Metrics for Short-Term Rental Hosts
- How to Track and Benchmark Your Metrics
- From Metrics to Action Quick Wins for Hosts
- Beyond the Numbers Balancing Efficiency and Guest Experience
- Conclusion Building Your Operational Flywheel
From Busy to Profitable The Power of Knowing Your Numbers
Most rental operators hit the same wall. Bookings are coming in, the calendar looks decent, and the team stays busy, but the business still feels fragile. One missed cleaner handoff or one burst of guest messages can throw off the whole week.
I've seen this most often with hosts who track only top-line performance. They know occupancy. They know nightly rate. They might even know monthly revenue. But they don't know how long turnovers take, which properties trigger the most support messages, or whether maintenance delays are damaging reviews and repeat bookings.
That's the difference between a busy portfolio and a profitable one. Busy tells you people are moving. Profitable tells you the operation is working.
Practical rule: If a problem surprises you more than once, it should become a metric.
Operational efficiency metrics became a formal management discipline in the late 20th century as businesses moved from isolated productivity checks to integrated dashboards, with guidance emphasizing a focused set of 3–5 high-value metrics rather than overwhelming teams with too much data, as explained in BOC Group's overview of measuring operational excellence.
That principle fits short-term rentals perfectly. You don't need a corporate reporting stack. You need a short list of numbers that tell you whether operations are protecting margin and guest experience, or eroding both. When you know your turnaround time, cleaning cost per stay, response load, and revenue quality, decisions get easier. Staffing gets cleaner. Guest communication gets sharper.
The best operators I know don't run on instinct alone. They use instinct to ask good questions, then use numbers to confirm where to act.
What Are Operational Efficiency Metrics for Rentals
A rental can look busy on the surface and still run inefficiently underneath. Guests are booking, cleaners are moving, messages are getting answered. Profit still slips because the operation takes too much labor, too many fixes, and too much reactive communication to deliver each stay.
Operational efficiency metrics measure that gap. They show how well your business converts time, staff effort, vendor spend, and operating systems into two outcomes that matter: a good guest stay and reliable margin.
For short-term rentals, these metrics matter because hospitality and efficiency are tied together. If check-in instructions are unclear, guest messages go up. If maintenance response is slow, reviews and repeat bookings suffer. If turnovers take too long, pricing flexibility shrinks and cleaner errors rise. Good operators track those links instead of treating guest experience and profitability as separate problems.
A useful dashboard answers operating questions
The goal is not to build a corporate reporting system. The goal is to run a better portfolio with fewer blind spots.
A practical dashboard should answer questions like these:
- Is the team moving fast enough? Turnaround time, response time, and repair completion speed answer that.
- What does each stay cost to deliver? Cleaning cost per stay, labor hours, and repeat maintenance issues expose that.
- Where is guest friction coming from? Check-in questions, house rule confusion, and recurring support topics point to process gaps.
- Are operations protecting revenue quality? You need to see whether occupancy and nightly rate are holding up after service issues, discounts, and preventable costs.
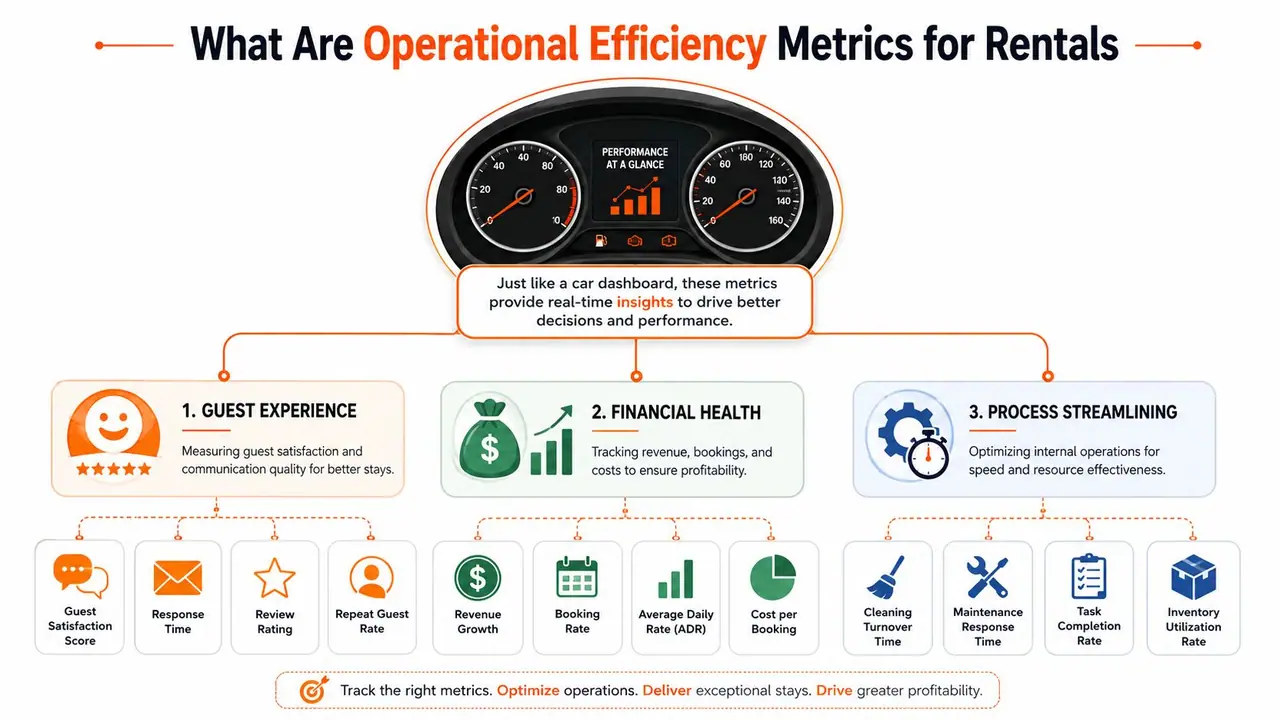
The simplest way to organize these numbers is in three buckets: guest experience, financial health, and process streamlining. That structure keeps hosts from obsessing over cost while service slips, or chasing revenue while the back-end operation gets harder to sustain.
The three buckets that matter most
Guest experience metrics show where the stay feels easy and where it breaks down. A spike in messages about parking, Wi-Fi, access, or appliance use usually means the property setup or guest instructions are weak. This is one reason I treat tools like digital welcome books as operational tools, not marketing extras. A good guide reduces repetitive questions, shortens response load, and gives guests faster answers without making the stay feel less personal. Hosts building a reporting stack around those patterns should review vacation rental analytics that connect guest behavior to operational decisions.
Financial health metrics show whether booked nights are turning into usable profit. Occupancy matters, but it is only one piece. The better view combines revenue with the costs and service load required to earn it. A high-performing listing that creates constant support work or repeated compensation claims is not as healthy as it looks in the calendar.
Process streamlining metrics cover the work behind the scenes. Turnovers, inspections, maintenance coordination, inventory readiness, and team capacity all sit here. In practice, small operational fixes often produce the fastest gains within these internal processes because they improve both margin and the guest stay at the same time.
A rental business rarely struggles because one number is off. It struggles because nobody tracks how service issues, labor, and revenue affect each other.
That is the job of operational efficiency metrics. They help hosts spot friction early, fix the process causing it, and protect both profitability and hospitality at the same time.
The 7 Essential Metrics for Short-Term Rental Hosts
A Friday checkout runs late, the cleaner arrives without enough linen, the next guest messages twice for check-in help, and by 4:00 p.m. the whole day is running behind. That kind of service failure rarely starts with one bad employee or one difficult guest. It starts with operators who track occupancy and revenue, but miss the numbers that explain why the stay felt disorganized.
For most short-term rental businesses, seven metrics are enough to show where profit leaks out and where guest friction starts. Used together, they do more than cut cost. They help you protect standards while running a tighter operation.
The metrics that expose operational drag
1. Turnaround time
Turnaround time measures how long it takes to reset a property from checkout to guest-ready status.
Turnaround time = guest-ready timestamp - checkout timestamp
This metric affects same-day booking flexibility, cleaner scheduling, inspection quality, and guest confidence. A long turnover is not always a staffing problem. I usually find one of three causes: poor supply placement, inconsistent cleaning scope, or a home setup that creates too many unnecessary steps.
2. Cleaning cost per stay
Cleaning cost per stay shows what each completed booking costs you in labor and reset expense.
Cleaning cost per stay = total cleaning spend / total completed stays
This is one of the fastest ways to spot operational waste. If two similar units produce very different cleaning costs, something is off. The cause might be linen logistics, oversized consumable use, travel time between properties, or a layout that adds labor every single turn.
3. Guest response time
Guest response time tracks how quickly your team replies to inbound questions.
Guest response time = total response time across guest messages / total guest inquiries
Fast replies matter, especially before check-in and during an active issue. But speed by itself can hide a broken process. If guests keep asking for the Wi-Fi code, parking instructions, or thermostat help, the fix is not just faster messaging. The fix is better pre-arrival communication and a clearer in-stay information system.
That is why I treat digital guidebooks as operating infrastructure. They reduce repetitive support demand, shorten response load, and give guests answers without making the stay feel automated.
4. Support message volume
Support message volume measures how many inbound guest messages a property generates over a given period.
Support message volume = total guest support messages for a property or period
Track messages about check-in, access, parking, appliances, house rules, Wi-Fi, and troubleshooting. You do not need a perfect tagging system on day one. You need enough consistency to see patterns.
A high-message property often has an information problem before it has a staffing problem. Hosts who want a clearer link between guest questions and operating decisions should review vacation rental analytics for guest behavior and operational decision-making.
Key STR Operational Metrics at a Glance
| Metric | What It Measures | Simple Formula |
|---|---|---|
| Turnaround Time | Time to make a unit guest-ready after checkout | guest-ready timestamp - checkout timestamp |
| Cleaning Cost Per Stay | Cleaning spend attached to each completed booking | total cleaning spend / total completed stays |
| Guest Response Time | Average time it takes to reply to guest inquiries | total response time / total guest inquiries |
| Support Message Volume | How much support demand a property creates | total support messages in period |
| Occupancy Rate | Share of available nights that are booked | booked nights / available nights |
| RevPAR | Revenue quality across occupancy and rate | total room revenue / available nights |
| Maintenance Incidents | Frequency of issues that disrupt operations or stays | total maintenance incidents in period |
5. Occupancy rate
Occupancy rate shows how often a listing is booked relative to the nights you could have sold.
Occupancy rate = booked nights / available nights
This number matters, but it needs context. High occupancy can still mean weak margins if you underprice, absorb heavy cleaning complexity, or create frequent guest issues. Full calendars do not always mean a healthy business.
6. RevPAR
RevPAR gives a better revenue view because it combines rate performance with how often the property is booked.
RevPAR = total room revenue / available nights
I rely on RevPAR because it forces a more disciplined conversation. A listing with lower occupancy but stronger rate control may outperform a listing that stays full at the wrong price. Composite measures like this are common in other service businesses too. The logic behind understanding key restaurant benchmarks applies here as well. Single metrics rarely explain operating quality on their own.
7. Maintenance incidents
Maintenance incidents track how often a property needs repair, troubleshooting, or manual intervention.
Maintenance incidents = total incidents in period
Count guest-reported issues, failed inspections, repeat repairs, and problems that interrupt the stay. This metric matters because maintenance hits both sides of the business at once. You pay for the fix, and you pay again through guest frustration, team distraction, refunds, or weaker reviews. If the same issue keeps showing up, the underlying problem is usually preventive maintenance or a poor replacement standard.
Why these seven work better than a bloated dashboard
These seven metrics cover the operating pressure points that affect short-term rental performance:
- Time: Turnaround time and guest response time
- Cost: Cleaning cost per stay
- Demand quality: Occupancy rate and RevPAR
- Operational reliability: Support message volume and maintenance incidents
A crowded dashboard usually creates one of two problems. The team ignores it, or the team chases the easiest number to improve instead of the one causing the true drag.
The better approach is tighter. Track the few numbers that connect workload, guest experience, and margin. If a metric does not help you improve service, control labor, reduce avoidable issues, or price inventory better, it does not belong on the main scorecard.
How to Track and Benchmark Your Metrics
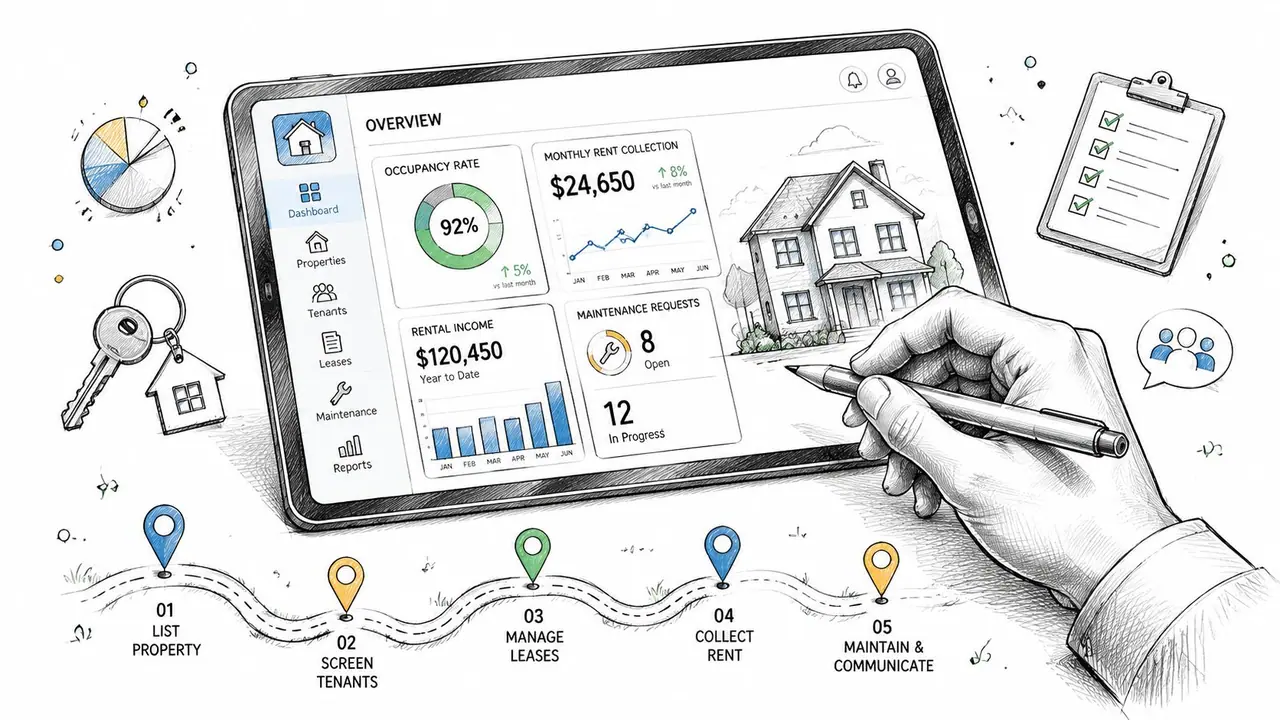
Tracking doesn't need expensive software or a business intelligence team. Most hosts already have the raw data. The primary work is pulling it into one place and reviewing it on a rhythm that leads to action.
Pull data from tools you already use
Start with the systems you already touch every week:
- PMS data: Reservations, check-in and checkout dates, assigned units, cleaner notes
- Channel data: Booking.com or Airbnb messaging trends, booking windows, guest questions
- Accounting records: Cleaning invoices, supply purchases, contractor spend
- Team logs: Maintenance tickets, task completion timestamps, recurring issue notes
- Spreadsheets: Still useful if you need one control sheet across several tools
For service-heavy operations, one strong benchmark is the pairing of MTTR and capacity utilization. MTTR is calculated as total downtime divided by the number of failures, while capacity utilization = (capacity used / total capacity available) × 100, as outlined in NetSuite's guide to operational KPIs. In rental terms, that helps you see both how quickly you recover from disruptions and whether your team is overloaded or underused.
Build a simple dashboard first
A basic Google Sheet or Excel file is enough to get moving. One tab per month. One row per property. A final summary tab for trends.
A simple layout might include:
- Property name
- Completed stays
- Booked nights
- Available nights
- Cleaning spend
- Support messages
- Maintenance incidents
- Average response time
- Turnaround time notes
- Revenue
Then add straightforward formulas:
- Occupancy rate:
=BookedNights/AvailableNights - Cleaning cost per stay:
=CleaningSpend/CompletedStays - RevPAR:
=Revenue/AvailableNights
If you're still assembling your systems, this comparison of affordable property management software can help you decide what should live in a PMS versus what still belongs in a manual tracker.
A useful habit is adding one free-text column called “cause.” If a metric moves sharply, write the likely reason in plain language: new cleaner, HVAC issue, road construction, bad lock instructions, longer family bookings, whatever applies. That context turns reporting into management.
Benchmark against your own operation
Most hosts obsess over market benchmarks too early. Your first benchmark should be your own history. Compare each property to itself over time, then compare similar units inside your portfolio.
This is common in other service businesses too. If you want a simple example of how operators use ratio thinking to spot performance gaps, MAJC's piece on understanding key restaurant benchmarks is worth reading. The industry is different, but the management logic carries over well.
Track trends before targets. A number doesn't need to be “good” on day one to be useful. It needs to be consistent enough to show you what changed.
That's how you avoid data overwhelm. One dashboard. One review cadence. A small set of operational efficiency metrics that tell you what's getting tighter, slower, noisier, or more profitable.
From Metrics to Action Quick Wins for Hosts
A metric only matters if it changes behavior. Once you can see the problem, the next move should be obvious enough that a manager or host can act on it this week, not someday.

When one metric goes off track
If support message volume is high, reduce avoidable questions before they hit your phone. Most repeat guest messages come from missing pre-arrival and in-stay information. Wi-Fi details, parking steps, entry instructions, appliance use, and checkout reminders should live in one mobile-friendly place that guests can open instantly. If you're building that communication flow, this guide on how to automate Airbnb messages is a practical starting point.
If guest response time looks fine but the team still feels buried, the issue is usually message quality, not message speed. Fast replies to repetitive questions don't create real relief. Rewrite templates, tighten arrival instructions, and remove any message that forces guests to ask a follow-up.
If turnaround time keeps slipping, inspect the handoff itself. Check whether cleaners are waiting on laundry, missing supplies, or arriving without confirmed departure status. Many instances of “slow cleaning” are due to bad sequencing.
The best quick wins usually come from removing repeatable confusion, not pushing people to work faster.
If maintenance incidents cluster around the same unit, stop treating them as isolated events. Look for pattern failures. Repeated lock issues, appliance confusion, or plumbing complaints often come from one weak system that needs replacement or clearer guest guidance.
Where automation helps and where it hurts
Automation works well when it removes routine friction. It fails when it replaces judgment. Scheduled pre-arrival messages, digital house guides, and standardized issue routing all help. Robotic responses to a frustrated guest with a broken air conditioner don't.
This walkthrough shows the kind of guest-facing system that can cut support noise while keeping information easy to access:
A few strong action rules:
- High check-in questions: Consolidate arrival details, parking, door access, and Wi-Fi into one guest-facing guide.
- High cleaning cost per stay: Standardize supply placement and photo-based reset checklists so cleaners don't improvise.
- Low RevPAR with decent occupancy: Review pricing strategy and minimum stays before pushing for more volume.
- Frequent repeat incidents: Create a preventive maintenance list by property, not just a repair log.
The host mistake I see most is trying to solve operational issues with more manual effort. That works for a weekend. Then the same questions return, the same delays repeat, and the business gets heavier again.
Beyond the Numbers Balancing Efficiency and Guest Experience
Hosts can get into trouble when they treat every metric like a race to the lowest cost or the fastest time. That's how teams end up rushing turnovers, overloading staff, and sending guests polished but unhelpful automated messages.
Fast is not always efficient
A common mistake in operations is optimizing for speed or utilization at the expense of experience. True efficiency links KPIs to customer outcomes like satisfaction and retention, and a lower cycle time isn't better if it creates defects or burnout, as noted in Moveworks' discussion of operational efficiency trade-offs.
That applies directly to rentals. The right goal isn't the fastest turnover. It's the fastest flawless turnover your system can produce. The right goal isn't the fewest guest messages. It's fewer avoidable messages while keeping help accessible when something goes wrong.
Use metrics to protect the stay
Good operators read numbers through the guest's eyes. If response time improves but complaints rise, the response probably became less useful. If cleaner utilization rises but inspection issues also rise, the schedule got too tight. If maintenance is deferred to protect margin, the guest pays for it later in stress and inconvenience.
That same balanced thinking matters in property upkeep and compliance. Pest-related issues are a good example, especially in high-turnover markets where one unresolved problem can trigger reviews, refunds, and repeat treatment costs. For operators in that situation, this guide for Florida property managers is a practical reference for thinking through responsibility and prevention.
Hospitality is the output. Operational efficiency metrics are the guardrails.
Use the numbers to support a better stay, not to strip one down to the cheapest possible version.
Conclusion Building Your Operational Flywheel
A strong rental operation runs on a flywheel. You track the right metrics. The metrics expose friction. You fix the process behind the friction. Guests get a smoother stay. Reviews improve. The business earns stronger revenue and fewer avoidable costs. That gives you more room to improve the system again.
That's how operators scale without feeling buried.
The key is keeping the dashboard tight. Track a handful of operational efficiency metrics that connect directly to workload, guest friction, and revenue quality. Ignore vanity numbers. Pay attention to patterns. When a metric moves, ask what changed in the operation.
You don't need to build a perfect reporting stack this week. Pick one metric that reflects a recurring headache in your business and start there. If guests keep asking the same things, track support message volume. If turnovers feel messy, track turnaround time. If revenue looks strong but profit feels thin, track cleaning cost per stay or RevPAR.
Start with one number. Use it to make one better decision. That's how the flywheel begins.
If you want a simple way to reduce repetitive guest questions and make your operation easier to manage, take a look at ScanStay. It gives guests one place to find check-in details, Wi-Fi, house rules, recommendations, and upsells, which helps hosts cut support noise without making the stay feel impersonal.