Mastering Vacation Rental Analytics: 2026 Growth Guide
Unlock your rental's potential with vacation rental analytics. Learn to track key KPIs and turn data insights into higher revenue and more bookings in 2026.
Most hosts know this feeling. You open your calendar, compare it to a competitor down the street, and start guessing. Are your rates too high. Too low. Is demand weak. Or did three new listings just hit your market and split the same pool of bookings?
That uncertainty is where most vacation rental mistakes start. Hosts cut prices too early, hold rates too long, chase the wrong channel, or blame the market when the actual problem sits inside the listing, the guest journey, or the operations behind it.
Good vacation rental analytics fixes that. It gives you a way to separate a market problem from a property problem. That matters because market signals often conflict. In the U.S. vacation rental market, Q1 2025 occupancy declined by about 3% year over year while guest nights increased by about 2%, which shows why a single metric can mislead you when supply is growing, according to Rentals United's vacation rental market summary.
If you're managing one property, analytics helps you stop reacting emotionally. If you're managing a portfolio, it helps you see where margin leaks, service friction, and weak pricing discipline are hiding. The best operators don't just ask, “How booked am I?” They ask, “Why did this happen, what changed, and what should I do next?”
Table of Contents
- Introduction Why Guess When You Can Know
- What Are Vacation Rental Analytics
- The 7 Key Metrics Every Host Must Track
- How to Collect and Validate Your Data
- From Data to Decisions Turning Insights Into Action
- Beyond Revenue The Untapped Goldmine of Operational Analytics
- Conclusion Putting Your Analytics Plan into Practice
- Frequently Asked Questions About Vacation Rental Analytics
Introduction Why Guess When You Can Know
A host notices weekends are still booking, but midweek nights have started to sit. Another sees decent occupancy, but revenue feels flat. A manager with ten units finds that one property gets far more guest messages than the rest, even though the homes look similar on paper.
Those aren't random annoyances. They're signals.
Vacation rental analytics is the discipline of reading those signals before they turn into lower revenue, more support load, and worse reviews. It isn't reserved for large management companies with analysts and dashboards everywhere. A solo host can use it. A co-host can use it. A regional operator can build an entire playbook around it.
The shift is simple. Stop asking, “How do I feel about performance?” Start asking, “What does the data say happened?”
You don't need perfect data on day one. You need a repeatable habit of checking the same indicators and acting on them consistently.
When hosts skip that habit, they usually overreact to whatever feels loudest. One slow week triggers a price cut. A bad review triggers a complete rewrite of the listing. A competitor's booked calendar triggers panic. Analytics gives context. Context keeps you from making expensive decisions based on noise.
What Are Vacation Rental Analytics
Managing a rental without analytics is like driving through fog without a dashboard. You may still move forward, but you don't know your speed, fuel level, or whether the engine is running hot.

In practical terms, vacation rental analytics means combining your own booking and operational data with market context, then using it to make better decisions. Reporting tells you what happened. Analytics tells you what probably caused it and what to do next.
Reporting shows numbers. Analytics shapes decisions
A monthly OTA report might show booked nights, revenue, and cancellations. That's useful, but it's still backward-looking. Analytics starts when you compare those numbers against pace, seasonality, listing type, channel mix, and guest behavior.
A few examples make the difference clear:
- Reporting: occupancy dropped last month.
- Analytics: occupancy dropped because new local supply increased, competitors discounted earlier, and your lead time shortened while your rates stayed static.
- Reporting: guest messages increased.
- Analytics: guest messages increased because check-in instructions were unclear and appliance questions spiked after a cleaner changed where the printed guide was placed.
That second layer is what experienced operators rely on.
The dashboard every host actually needs
Professional operators now treat analytics as core management infrastructure, not a nice extra. One 2025 industry summary says the global vacation rental market reached $87.1 billion in 2024, with average RevPAR stabilizing around $95 across major markets, which reinforces why performance tracking now centers on more than occupancy alone, according to Staystra's 2025 vacation rental data and trends roundup.
For day-to-day management, I think of analytics as three connected dashboards:
| Dashboard area | What it answers | Common inputs |
|---|---|---|
| Revenue | Are rates and occupancy producing enough income? | ADR, occupancy, RevPAR, pace |
| Demand | Is the market moving or is this just my property? | booking window, local comps, events, supply shifts |
| Operations | Where is guest friction hurting time or reviews? | messages, guide usage, complaints, review themes |
Practical rule: If a number doesn't change a decision, it doesn't belong on your main dashboard.
Hosts often overbuild analytics. They track everything and use nothing. Start with a short list of metrics tied to real actions. That's how analytics becomes a working system instead of another spreadsheet you ignore.
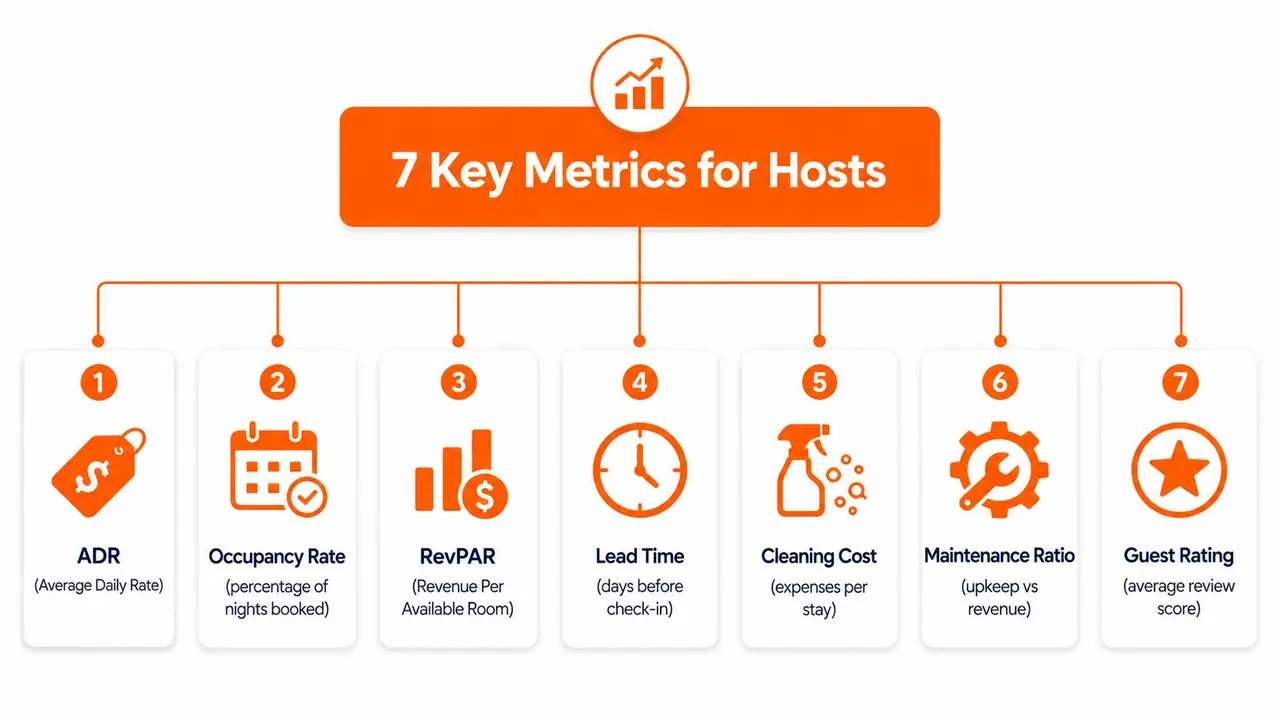
The 7 Key Metrics Every Host Must Track
Most dashboards get crowded fast. The fix isn't more data. It's better selection. If you track the right seven metrics, you'll catch most pricing problems, demand shifts, and operational leaks early enough to act.
Revenue metrics that show market fit
1. Occupancy rate
Formula:
Occupied nights ÷ available nights
This tells you how consistently a property fills. Occupancy is useful, but it often gets too much attention because it's easy to understand. High occupancy can hide underpricing. Low occupancy can be acceptable if your rate strategy is stronger.
2. Average Daily Rate (ADR)
Formula:
Accommodation revenue ÷ booked nights
ADR shows how much guests pay per booked night on average. It's your pricing signal. If ADR climbs while occupancy holds, your market fit is strong. If ADR falls and occupancy still doesn't improve, the issue usually isn't price alone.
3. Revenue Per Available Rental (RevPAR)
Formula:
ADR × occupancy rate
or
Total revenue ÷ available nights
This is the cleanest revenue-efficiency metric because it combines pricing and utilization in one number. Expert guidance from PriceLabs on short-term rental analytics recommends pairing RevPAR with pacing data so you can separate property-level performance from broader market movement.
If you're still judging performance only by occupancy, you're missing the main business question: did the property earn enough from the nights it had available? That's why RevPAR belongs near the top of every host dashboard. It also gives helpful context when you're evaluating broader questions like whether Airbnbs are profitable.
Booking behavior metrics that shape strategy
4. Booking lead time
Formula:
Average number of days between booking date and check-in date
Lead time tells you how early guests commit. A property with short lead times needs more responsive pricing. A property with longer lead times may justify firmer rates further out. Watch for shifts here. They often show changing traveler behavior before occupancy changes show up.
5. Cancellation rate
Formula:
Canceled bookings ÷ total bookings
A high cancellation rate creates fake confidence in your calendar. It also distorts staffing, pricing, and inventory planning. Some channels and rate plans naturally carry more cancellation risk, so compare this metric by source, not only in aggregate.
6. Channel performance
There's no single universal formula here. Track each channel by a small set of comparable fields:
- Revenue produced: How much business did the channel deliver
- ADR quality: Did the channel bring higher-value bookings or only discounted nights
- Lead time profile: Does the channel help fill near-term gaps or longer booking windows
- Cancellation behavior: Are those bookings stable
- Operational burden: Do guests from that channel generate more pre-arrival questions or edge cases
Hosts often chase whichever channel sends volume. That's not always the right choice. The better channel is the one that produces profitable, manageable stays.
Operational metrics that protect margins
7. Guest satisfaction metrics
Formula depends on what you collect. The practical version is simple: track review patterns, recurring complaint themes, and internal service notes.
Most vacation rental analytics setups fail to provide sufficient depth at this point. Revenue dashboards indicate that performance has shifted, while guest satisfaction signals often explain the underlying cause. If reviews decline following a change in cleaning staff, if check-in complaints increase after a lock update, or if questions about appliances recur, operational adjustments may impact the business more significantly than a pricing modification.
A useful weekly review looks like this:
| Metric | What to check | What it may mean |
|---|---|---|
| Occupancy | booked vs available nights | demand or pricing issue |
| ADR | rate trend by stay date | rate strength or discounting |
| RevPAR | combined revenue efficiency | true earnings quality |
| Lead time | bookings arriving earlier or later | pacing change |
| Cancellations | trend by channel or policy | unstable demand |
| Channel performance | source mix and quality | distribution problem |
| Guest satisfaction | repeat complaints and review themes | operational friction |
The point isn't to stare at all seven every day. The point is to track them consistently enough that unusual movement stands out before it becomes a month-end surprise.
How to Collect and Validate Your Data
Most analytics problems aren't analytics problems. They're data problems. If the inputs are weak, the conclusions will be weak too.
What each data source is good for
The most reliable setup combines first-party reservation data with outside market intelligence. According to Key Data's overview of vacation rental analytics, high-quality analytics depends on that blend. The same source notes that integrations across 65+ PMS systems support real-time benchmarking, while market dashboards help operators read pace, supply growth, and competitor movement.
That combination matters because each source has limits:
| Data source | Best use | Main weakness |
|---|---|---|
| PMS or channel manager | reservations, revenue, stay patterns, owner blocks | doesn't tell you what the market is doing |
| OTA reports | listing performance by channel | often fragmented across platforms |
| Market data tools | pace, comps, local supply, rate movement | can be misleading if underlying data quality is poor |
| Guest communication tools | question themes, pre-arrival friction, service demand | often ignored in revenue reviews |
Your PMS should be the source of truth for booked revenue, available nights, owner usage, and stay behavior. OTA dashboards are helpful, but they're channel views, not the whole business. Market tools are where you get context.
How to sanity-check the numbers
A lot of hosts trust scraped data too quickly. That's risky. One source notes that scraped OTA availability can mistake blocked nights for bookings, leave stale prices in place, and distort occupancy when owner stays or manual blocks aren't visible, according to Key Data's discussion of property management data quality.
That doesn't mean market tools are useless. It means you need a validation habit.
Use a simple check:
- Match revenue to your PMS first. If your dashboard doesn't match your actual folio or payout view, stop there.
- Separate owner blocks from sellable inventory. Otherwise occupancy calculations become nonsense.
- Compare trends, not isolated dates. One odd comp set can mislead you. Repeated movement matters more.
- Review by segment. Bedroom count, amenity set, and property type matter. A studio isn't a comp for a four-bedroom house with a hot tub.
Scraped data can point you toward a question. It shouldn't automatically decide your pricing.
Good vacation rental analytics starts with trust in the numbers. If you don't trust the data, you won't act on it. And if you won't act on it, the dashboard is just decoration.
From Data to Decisions Turning Insights Into Action
The value of analytics shows up when it changes what you do this week, not when it gives you a prettier report next month.

A useful review process ties each metric to a specific response. Otherwise teams keep checking dashboards and calling that work. It isn't. The action is the work.
Pricing decisions
If lead time shortens but occupancy remains healthy, your rates may be a little soft close-in. If occupancy is weak far out and pacing trails similar listings, your pricing may be too firm or your listing may not be converting at that price point.
What works is making pricing decisions in context:
- Strong occupancy and short lead time: test higher close-in rates
- Weak pace but stable market demand: inspect your listing quality before defaulting to discounts
- ADR holding while RevPAR falls: you may be protecting rate while losing too many nights
- Cancellations rising: review rate plan rules and booking source quality, not just headline pricing
A lot of hosts confuse activity with performance. Frequent rate changes don't automatically mean smart pricing. Better decisions usually come from slower, cleaner interpretation.
Marketing decisions
Channel data should change where you put effort. If one channel delivers solid ADR but inconsistent occupancy, that can justify targeted promotions, stronger listing content, or improved calendar strategy there. If another channel sends low-value stays with more cancellations, don't reward it just because it fills dates.
This is also where portfolio managers benefit from standardization. When every listing is measured the same way, weak performers stop hiding. Marketing spend gets more disciplined, and you stop treating every property as if it needs the same fix.
For operators refining their channel mix and guest funnel, practical Airbnb hosting tips for stronger operations can complement the analytics side by tightening the basics that influence conversion and guest experience.
Guest experience decisions
The most overlooked action area is guest friction. If review themes worsen around check-in, cleanliness, noise, or appliance confusion, that isn't a soft issue. It's an operating issue with financial consequences.
Look for patterns like these:
| Signal | Likely issue | Better response |
|---|---|---|
| More arrival-day messages | unclear check-in instructions | rewrite access flow, add visuals |
| Repeated Wi-Fi questions | info isn't visible enough | move it higher in guest materials |
| Appliance complaints | guests can't self-serve | add short how-to guidance |
| Cleanliness mentions in reviews | checklist or inspection gap | audit turnover process |
| Upsell interest but low take-up | poor timing or weak placement | reposition the offer pre-arrival or during stay |
A host who sees only bookings tends to treat guest support as background noise. An operator who tracks service friction sees where time is being burned and where reviews are being lost.
Here's a simple decision model I use:
- Find the shift. Which metric changed.
- Confirm the cause. Market issue, pricing issue, listing issue, or operations issue.
- Choose one response. Rate move, channel change, process fix, or guest communication update.
- Review the result. Did the signal improve over the next cycle.
Later in the review, a visual walkthrough can help teams align on what changed and what to test next.
The best dashboards don't answer every question. They help you ask the next useful one faster.
Beyond Revenue The Untapped Goldmine of Operational Analytics
Revenue analytics gets most of the attention because it's easy to summarize. Occupancy, ADR, and RevPAR fit neatly on one screen. But many of the problems that drag down performance begin in operations, not pricing.

One industry discussion points out that most analytics content focuses on pricing and occupancy while rarely addressing how guest self-service tools affect support load and review scores. It argues that guest behavior data can influence labor costs and ancillary revenue, moving analytics beyond revenue management and into operational intelligence, according to Direct Booking Tools on forward-looking demand analytics.
What guest behavior data tells you
Operational analytics asks different questions:
- Which guest questions repeat every week
- Which house rules create the most confusion
- Which instructions guests use
- Which upsell offers get attention and which get ignored
- Which properties create more support load per stay
Those answers matter because they point to fixes that reduce manual work. Better instructions can prevent messages. Better pre-arrival guidance can reduce check-in stress. Better timing on local recommendations or add-ons can improve in-stay revenue without adding pressure to the guest.
Where digital welcome books fit
Digital welcome books function as analytics tools rather than just simple convenience resources. If guests frequently access information regarding Wi-Fi, parking, the hot tub, or checkout procedures, those patterns highlight specific areas of confusion. If a section you considered important remains unused, the problem might involve timing, placement, or clarity.
One option in this category is vacation property management guidance from ScanStay, which aligns with the broader idea that guide usage data can support operational decisions. In practice, hosts can use scan behavior and section engagement to refine what guests see first, what gets simplified, and what should be surfaced before the stay instead of during it.
That kind of data won't replace RevPAR. It completes it.
Conclusion Putting Your Analytics Plan into Practice
Hosts who guess stay reactive. Hosts who measure build control.
The practical win from vacation rental analytics isn't that you get more charts. It's that you stop making blind decisions about pricing, channels, and guest operations. You start seeing which problems belong to the market, which belong to the listing, and which belong to your internal process.
If you're setting up your system, keep the first month simple:
- Choose three priority KPIs. Start with one revenue metric, one demand metric, and one operational metric.
- Track them weekly in one place. A spreadsheet is fine if the numbers are consistent.
- Hold one monthly review. Pick one action from the data and implement it before the next review.
Don't wait for a perfect dashboard. Most operators improve because they review consistently, validate what they're seeing, and act with discipline. That's the competitive edge.
Frequently Asked Questions About Vacation Rental Analytics
A few questions come up almost every time hosts start building an analytics habit. The short answers are below.
| Question | Answer |
|---|---|
| What is the most important vacation rental metric? | If I had to pick one, it would be RevPAR because it combines rate and occupancy into one efficiency metric. But no single metric is enough on its own. You need at least one demand signal and one operational signal beside it. |
| Do small hosts really need analytics? | Yes. A host with one property can still make poor pricing decisions, rely on weak channels, or lose time to repetitive guest questions. Analytics helps smaller operators avoid guesswork earlier. |
| How often should I review my numbers? | Weekly is enough for most hosts. Check pace, bookings, and guest friction regularly. Do a more deliberate monthly review for bigger decisions. Daily checking usually creates noise unless you're managing high volume or highly dynamic markets. |
| Should I trust OTA dashboards alone? | No. OTA dashboards are useful, but they only show part of the business. Your PMS or first-party reservation data should anchor revenue and availability, and market tools should provide context. |
| What if my market data conflicts with my booking data? | Trust your own reservation data first, then investigate the difference. Comp sets may be poor, blocked nights may be misread, or your property may simply be behaving differently from the market average. |
| What operational metrics should I track if I don't have a big system? | Start with repeated message topics, review themes, check-in issues, and support-heavy properties. Even a manual log can reveal patterns that hurt time and guest satisfaction. |
| Can guest guide or welcome book data really help performance? | Yes, qualitatively. It helps you see what guests need most, where they get stuck, and what content deserves better placement. That can reduce support load and improve the stay experience. |
| Do I need special software to start? | No. Software helps once you scale, but the habit matters more than the tool. A basic spreadsheet plus exports from your PMS, OTA dashboards, and guest communications can get you started. |
If your current setup tracks bookings but not guest behavior, you're only seeing half the picture. ScanStay gives hosts a digital welcome book with QR-based guest access to check-in details, Wi-Fi, house rules, local recommendations, and upsells, plus scan analytics on supported plans so you can see which information guests use and refine the stay experience with real operational signals.