Boost Your Occupancy Rate Airbnb: 2026 Strategy Guide
Optimize your occupancy rate airbnb with proven 2026 strategies. Learn to calculate benchmarks and implement smart pricing to maximize your rental income.
You're probably looking at your calendar, seeing more empty nights than you want, and asking the same question every new host asks: is this bad, or is this just normal for my market?
That question matters because occupancy rate Airbnb performance can look healthy on paper while the business still underperforms. A full calendar at weak nightly rates can be worse than a slightly lighter calendar at stronger rates. New hosts often chase booked nights first and only later realize they trained the market to expect discounts.
The better approach is to treat occupancy as a decision tool, not a vanity metric. It helps you judge pricing, listing quality, seasonality, and booking friction. But the target isn't “as high as possible.” The target is the occupancy level that leaves you with the strongest revenue after real-world costs and workload.
Table of Contents
- What Is Airbnb Occupancy Rate and Why Does It Matter
- How to Correctly Calculate Your Airbnb Occupancy Rate
- Benchmarking Your Occupancy Rate Against Your Market
- The Profitability Triangle Occupancy ADR and RevPAR
- How to Find and Track Your Occupancy Rate
- Proven Strategies to Increase Your Airbnb Occupancy Rate
What Is Airbnb Occupancy Rate and Why Does It Matter
Occupancy rate is the percentage of nights your property was booked out of the nights it was available to book. At a basic level, it tells you how well your listing converts availability into stays.
That makes it one of the clearest health checks in short-term rentals. If your occupancy is soft, the issue usually sits somewhere in pricing, listing presentation, guest trust, booking rules, seasonality, or local demand. If it's strong, that usually means your listing is positioned well for the guests you want.
What occupancy really tells you
Occupancy isn't just a score. It's a signal.
A low number can mean your nightly rate is too high for the current demand window. It can also mean your photos don't match the market, your title is weak, your minimum-stay rules are too restrictive, or your review profile isn't doing enough to convert views into bookings.
A high number can also be misleading. If you filled the month by cutting rates too hard, you may have increased workload without improving profit.
Practical rule: Don't ask, “How do I fill every night?” Ask, “Which nights are worth filling at my target rate?”
Why hosts get this wrong
Many hosts treat occupancy like the main goal because it's easy to understand. Empty nights feel like failure. But in practice, busy and profitable are not the same thing.
Use occupancy rate Airbnb data to answer questions like these:
- Pricing fit: Are guests booking at your current rate or resisting it?
- Listing strength: Does your page earn bookings once travelers click?
- Calendar strategy: Are your stay rules helping or blocking demand?
- Seasonal timing: Are you reacting early enough as demand rises or falls?
If you manage with that mindset, occupancy becomes useful. If you chase it blindly, it becomes expensive.
How to Correctly Calculate Your Airbnb Occupancy Rate
The formula is simple:
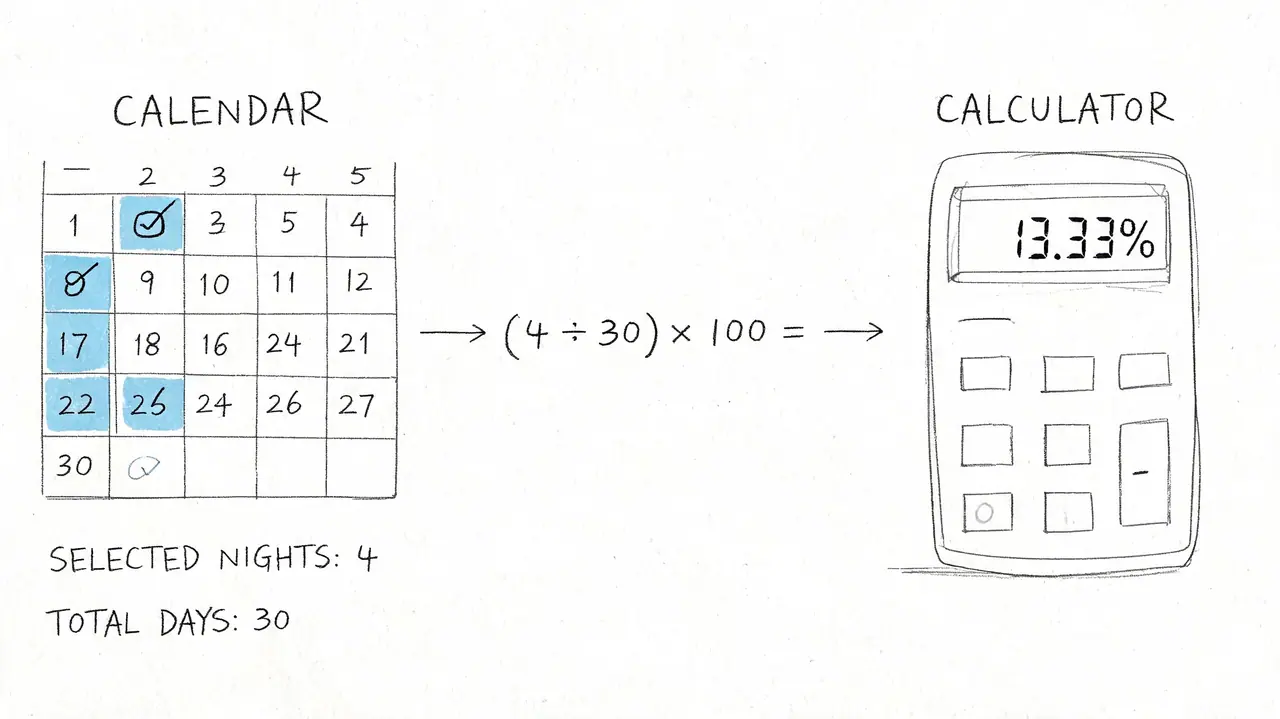
Occupancy rate = booked nights / available nights × 100
Most hosts understand the top half of that formula. The trouble starts with the denominator. “Available nights” does not mean every night in the month if some nights were never sellable in the first place.
The denominator is where most mistakes happen
If you block nights for owner use, maintenance, or planned closures, those nights shouldn't be counted as available inventory in your business calculation.
One clear example from Techvestor's occupancy calculation guide shows a 30-day month with 18 booked nights, 5 owner-use nights, and 2 maintenance nights. That leaves 23 available nights, so the correct occupancy rate is 78.3%. If you incorrectly divide by all 30 days, you get 60%, which creates an 18.3-point difference.
That difference is big enough to distort pricing decisions, portfolio reporting, and performance reviews.
A practical way to calculate it each month
Use this process:
Start with the days in the period
Pick the month, quarter, or trailing period you want to measure.Subtract nights that were never for sale
Remove owner stays, maintenance blocks, and any intentional closures.Count booked nights only from true inventory
This gives you actual sold nights against actual sellable nights.Multiply by 100
That gives you the percentage.
Here's the logic in a quick table:
| Metric | Count |
|---|---|
| Total nights in month | 30 |
| Owner-use nights | 5 |
| Maintenance nights | 2 |
| Available nights | 23 |
| Booked nights | 18 |
| Correct occupancy rate | 78.3% |
Why this matters operationally
If your denominator is wrong, every decision that follows gets weaker. You might think pricing is broken when the actual issue is blocked inventory. Or you might assume a listing is healthy when you're overstating performance by excluding friction elsewhere.
Track occupancy the same way every month. Consistency matters as much as accuracy, especially if you manage more than one unit.
For portfolio managers, this becomes even more important. One property manager may exclude maintenance blocks while another includes them. That makes property-to-property comparisons unreliable unless everyone uses the same rules.
Benchmarking Your Occupancy Rate Against Your Market
The fastest way to misread your business is to compare your listing to a generic national headline.
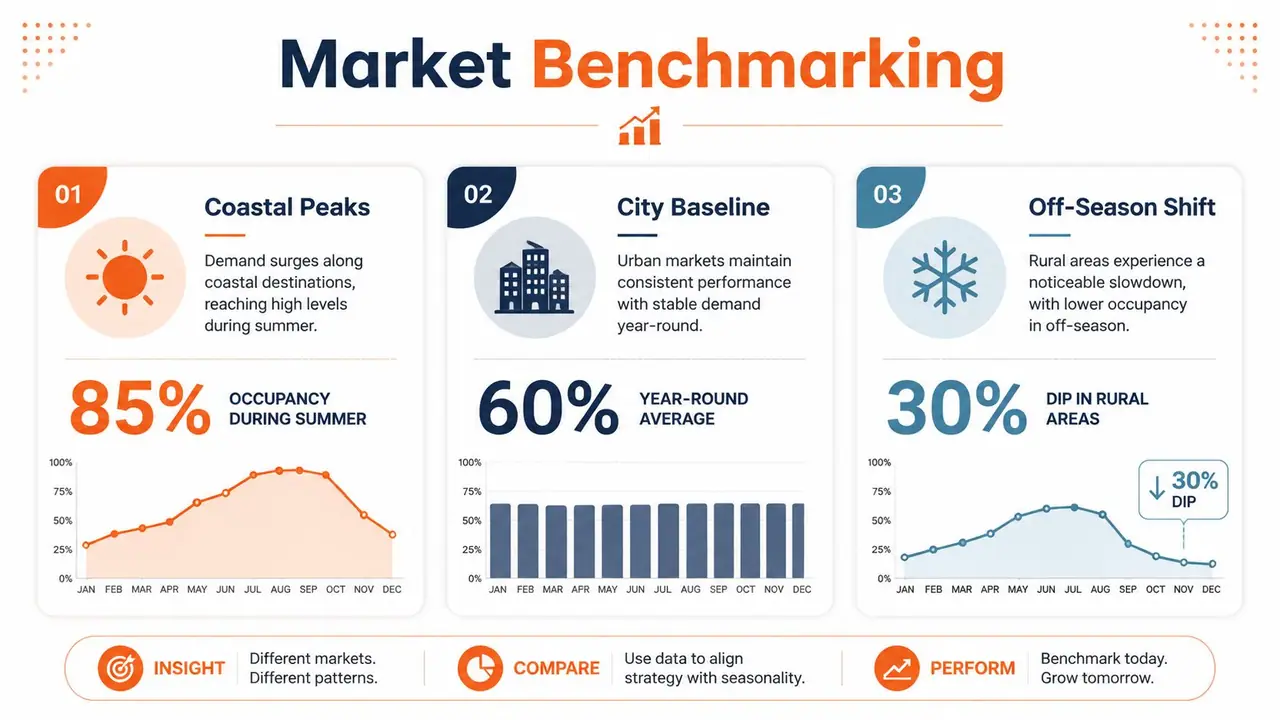
Airbnb occupancy is local. Not just by country or state, but by city, neighborhood, property type, and season. The same listing strategy that works in a drive-to leisure market won't behave the same way in an urban market with tighter regulations and different booking windows.
National averages are a weak benchmark
According to AllTheRooms' city-level occupancy review, the U.S. average Airbnb occupancy rate was 48% in 2023. In that same dataset, top U.S. markets ranged from 36.9% in Nashville to 25.5% in Paradise, NV. The same source reported the United Kingdom at 23.8% for 2023, while Australia showed city variation including Sydney at 15.5%, Melbourne at 20.3%, Brisbane at 30.7%, Surfers Paradise at 24.7%, and Byron Bay at 21.9%.
That spread tells you something important. A single “good occupancy” benchmark doesn't travel well.
What a useful benchmark looks like
A useful benchmark has four filters:
- Location: Your comp set should be in your immediate market, not just your metro area.
- Property type: Entire homes, private rooms, cabins, and apartments behave differently.
- Season: A shoulder-month result shouldn't be judged against peak-season demand.
- Restrictions: Minimum stays, cleaning fees, and cancellation policies affect booking pace.
If you skip those filters, you'll compare your listing against inventory that attracts different guests under different conditions.
The host who beats local comps wins. The host who beats a national average may still be underpricing.
How to benchmark like a working operator
Professional hosts typically use market data platforms to build a local comp set, then compare their own pacing and realized occupancy against that narrower view. The point isn't to memorize one number. It's to answer practical questions:
- Are weekends filling at the same pace as similar listings?
- Are midweek gaps normal in your neighborhood?
- Are your stay rules too rigid for current demand?
- Are nearby competitors holding rate better than you?
Recent industry reporting also shows that U.S. occupancy estimates can vary by provider. Awning's occupancy overview says the U.S. average Airbnb occupancy rate in 2026 is approximately 56%, while AirDNA reported 54.4% in 2023, and Awning also listed examples such as Nashville at 65%, Austin at 61%, Savannah at 66%, and Lake Tahoe at 60%, with peak-season levels reaching 80% in Lake Tahoe and 82% in Scottsdale. That gap doesn't mean one number is useless. It means occupancy models depend on coverage, timing, and market mix.
For day-to-day decisions, hyperlocal context beats broad averages every time.
The Profitability Triangle Occupancy ADR and RevPAR
Most hosts focus on occupancy first because it's the most visible metric. Revenue usually improves when you stop looking at it alone.
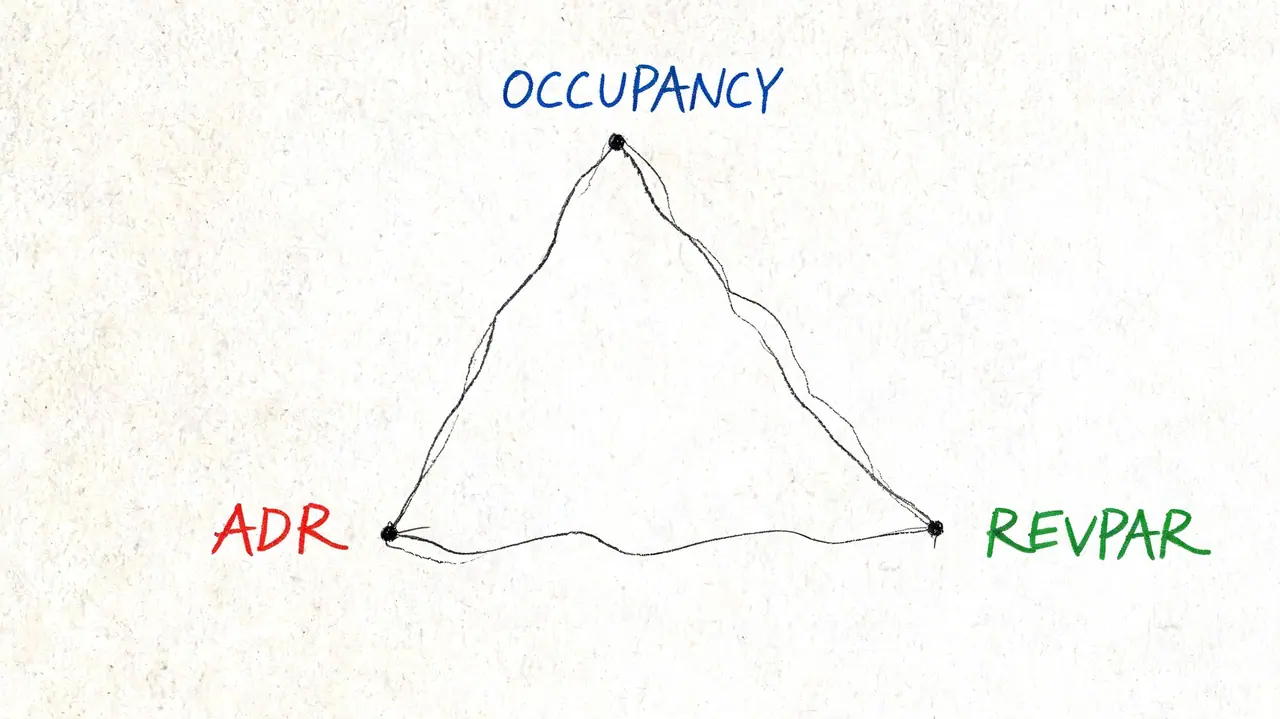
The stronger framework is a triangle: occupancy, ADR, and RevPAR. These three belong together. If you only push one corner, the other two move.
Occupancy and ADR pull against each other
ADR is your average daily rate. It tells you what guests paid per booked night. In real operations, occupancy and ADR often act like a seesaw.
Cut price aggressively and occupancy may rise. Push rates too high and bookings may slow. Neither result is automatically good or bad. It depends on what happens to total revenue and margin.
According to Hospitable's guide to Airbnb occupancy, a “good” Airbnb occupancy rate is often considered between 60% and 70% in many markets, and their example notes that 20 booked nights in a 30-day month equals 66.7% occupancy. The same guidance also notes that raising occupancy by lowering ADR can reduce total revenue, which is why hosts should evaluate occupancy alongside revenue per available night.
RevPAR is the balancing metric
RevPAR stands for revenue per available night. It shows how effectively your property turns available inventory into revenue, not just bookings.
That matters because two listings can have very different economics:
| Listing style | What usually happens |
|---|---|
| Lower-rate strategy | More nights fill, but each booking may produce less revenue and more turnover |
| Higher-rate strategy | Fewer nights fill, but each stay can carry stronger revenue and less operational strain |
| Balanced strategy | Enough nights fill at a healthy rate, producing the best use of inventory |
A lot of new hosts assume fuller always means better. It doesn't. If lower rates bring shorter stays, more cleanings, more guest messaging, and weaker margins, you've bought occupancy at the wrong price.
“The best occupancy rate isn't the highest one. It's the one that supports the strongest RevPAR.”
That's also why it helps to understand the broader question of whether Airbnbs are profitable before obsessing over a single metric. Profit comes from the relationship between rates, utilization, operating effort, and guest quality.
What to do with this in practice
When occupancy drops, don't slash rates automatically. Check the full picture:
- Booking pace: Are reservations coming in later this season?
- Lead time: Are guests in your market booking closer to arrival?
- Comp behavior: Are similar listings also soft?
- Rate resistance: Did bookings slow right after a price increase?
The answer is rarely “lower everything.” Most of the time, the right move is a controlled adjustment paired with better listing conversion and cleaner calendar rules.
How to Find and Track Your Occupancy Rate
Airbnb gives you basic performance visibility inside the host dashboard. That's a fine starting point for a single property, especially if you're still learning how your market moves.
In practice, hosts usually check performance data in the dashboard areas tied to listing results, booking activity, and optimization suggestions. Depending on the account layout, that often includes performance reporting and recommendation areas that flag pricing or setup issues.
What to review inside Airbnb
Look for patterns, not just one isolated percentage.
Check things like:
- Booked vs. available nights: This gives you your core occupancy picture.
- Date gaps: Empty one-night or two-night holes often point to stay-rule friction.
- Future pacing: Compare how next month is building relative to this month.
- Conversion signals: If views are steady but bookings lag, the problem may be your page or pricing.
If you manage manually, a simple spreadsheet still works. Track available nights, booked nights, ADR, and notes on major changes such as photo updates, pricing shifts, event periods, or maintenance blocks.
When third-party tools become necessary
Managing multiple units or seeking deeper competitive context often means Airbnb's native view falls short. Professional hosts rely on tools like AirDNA, PriceLabs, and Wheelhouse for market benchmarking, pricing support, and pace analysis.
Operations tools matter too. Strong occupancy depends on more than price. Faster guest communication, cleaner check-in instructions, and fewer repetitive support messages improve review quality and reduce friction. Hosts who want a broader operational system can also review vacation property management workflows to tighten the process behind the calendar.
The key is to track the same inputs weekly. Random checking creates random decisions.
Proven Strategies to Increase Your Airbnb Occupancy Rate
Most occupancy problems aren't caused by one dramatic mistake. They come from small leaks across pricing, presentation, calendar rules, and guest trust. Fixing those leaks usually lifts bookings without forcing you to discount every open night.
The bigger point is this: don't chase a generic benchmark. Some guides talk about 60% to 70% as healthy occupancy, but that can ignore local realities. Mashvisor's discussion of Airbnb occupancy notes that many guides promote those general ranges while some major cities have historically shown rates in the mid-20s, including New York City at 24.6% in 2021 and Los Angeles at 24.2% in 2021. That's why profit-based targets matter more than one-size-fits-all occupancy goals.
Fix the listing before you touch the price
A weak listing can't be rescued by clever pricing alone.
Start with the parts guests use to decide in seconds:
- Photos: Lead with your strongest differentiator. That might be the view, design, workspace, hot tub, or family-friendly layout.
- Title: Say what matters most. Clear beats clever.
- First five lines of description: Guests skim. Put the value proposition early.
- Amenity accuracy: Don't let guests guess about parking, Wi-Fi, air conditioning, stairs, or pet policy.
Many hosts lower rates when the underlying issue is that the listing doesn't answer obvious questions. Better clarity often improves conversion without changing price.
Adjust the calendar rules that quietly block demand
Calendar settings cause more vacancy than most new hosts realize.
Common problems include minimum stays that are too high for shoulder periods, blocked dates that were never reopened, and arrival restrictions that create awkward gaps. A good operator checks the calendar like a retailer checks shelf stock. Every unavailable night should be intentional.
Try a periodic review of:
- Minimum-night settings by season
- Gap-night opportunities between longer bookings
- Far-out availability for planners
- Last-minute openness for local or drive-in demand
Small rule changes often enable nights you already had demand for.
A half-empty calendar doesn't always mean low demand. Sometimes it means your rules made the easy bookings impossible.
Use pricing with precision, not panic
Rate management works best when it responds to demand windows, not emotion. If a weekend isn't booking, the answer may be a modest adjustment. It may also be better photos, stronger reviews, or a cleaner value proposition.
A solid pricing routine usually includes:
Review pacing by stay date
Focus on how quickly specific weekends and event periods are filling.Watch neighboring inventory
Don't copy competitor rates blindly, but don't ignore them either.Protect high-demand nights
Don't discount obvious compression dates too early.Use targeted offers carefully
Last-minute discounts and longer-stay offers can help fill weak pockets without flattening the whole calendar.
Hosts who want more tactical ideas can browse practical tips on Airbnb hosting and compare them against their own market behavior.
Improve the guest experience because it affects occupancy
Occupancy doesn't start when the guest arrives. It starts when future guests read your reviews.
Cleaner stays, simpler instructions, and fewer avoidable questions lead to better guest sentiment. Better guest sentiment supports stronger reviews. Stronger reviews improve conversion, which makes future occupancy easier to maintain without cutting rates.
That's why operational tools matter. For example, ScanStay gives hosts a digital welcome book through a QR code so guests can access Wi-Fi, check-in details, house rules, local recommendations, and video instructions in their mobile browser. In practical terms, that reduces repetitive messaging and makes the stay feel more organized.
Here's a useful walkthrough on the hosting side of the business:
Focus on review-driven conversion
The occupancy gains that last usually come from stronger conversion, not endless discounts.
Build for that by tightening the moments guests remember:
- Arrival: Make entry simple and stress-free.
- In-stay support: Answer common questions before they're asked.
- Cleanliness and maintenance: Remove small annoyances that trigger mediocre reviews.
- Checkout: Keep it straightforward and reasonable.
If guests consistently feel that the property matched the listing and the stay was easy, your reviews start doing part of the sales job for you.
Protect profitable occupancy, not just busy occupancy
A packed calendar can create more cleanings, more guest turnover, and more message volume. If the rates behind those bookings are weak, you may be working harder for less.
That's why the strongest hosts set their own floor. They know which nights can be discounted, which nights should be held firm, and which bookings create more hassle than value. Profit-optimized occupancy is disciplined occupancy.
If you want fewer repetitive guest questions and a cleaner stay experience that supports better reviews, ScanStay is worth a look. It lets hosts replace paper binders and scattered messages with a single QR-based digital guide, which can make daily operations easier while helping guests find the information they need without waiting on you.