Short Term Rental Analytics: Metrics That Drive Revenue
Master short term rental analytics with the metrics, dashboards, and workflows that move revenue. Practical guidance for hosts.
High occupancy is the most popular advice in short term rental analytics, and it's often the wrong target. A calendar packed with discounted midweek stays can look healthy while expensive peak dates sell too cheaply, cleaning costs rise, and net revenue stalls. The useful question isn't “How full was the property?” It's “Which pricing, availability, and operating decision should change next?”
The market gives hosts little room for passive reporting. The global short-term vacation rental market was valued at USD 149.2 billion in 2025 and is projected to reach USD 362.4 billion by 2033, with North America holding the largest regional revenue share at 34.6% in 2025, according to Grand View Research's market analysis. Airbnb alone reported more than 491 million nights and experiences booked in 2024, nearly USD 82 billion in gross booking value, and USD 11.1 billion in full-year revenue, as detailed in Airbnb's 2024 financial results.
Good analytics turns those market pressures into decisions. It tells you whether to hold a date, raise a weekend rate, accept a longer stay, relax a minimum-stay rule, or stop buying bookings from a channel that produces little net income.
Table of Contents
- Why Most Hosts Misread Their Own Performance Data
- Core Revenue Metrics Every Host Must Track Together
- Behavioral Metrics That Reveal Guest Booking Patterns
- Building a Reliable Data Collection Workflow
- Designing Dashboards for Single and Multi-Property Portfolios
- Advanced Analytics Techniques Worth the Investment
- Action Plans and Quick Wins You Can Implement This Week
Why Most Hosts Misread Their Own Performance Data
A high occupancy rate doesn't prove that a property is performing well. It only tells you how much of the available calendar sold. If the host reduced rates to fill weak nights and failed to capture demand on premium dates, occupancy can rise while revenue quality declines.
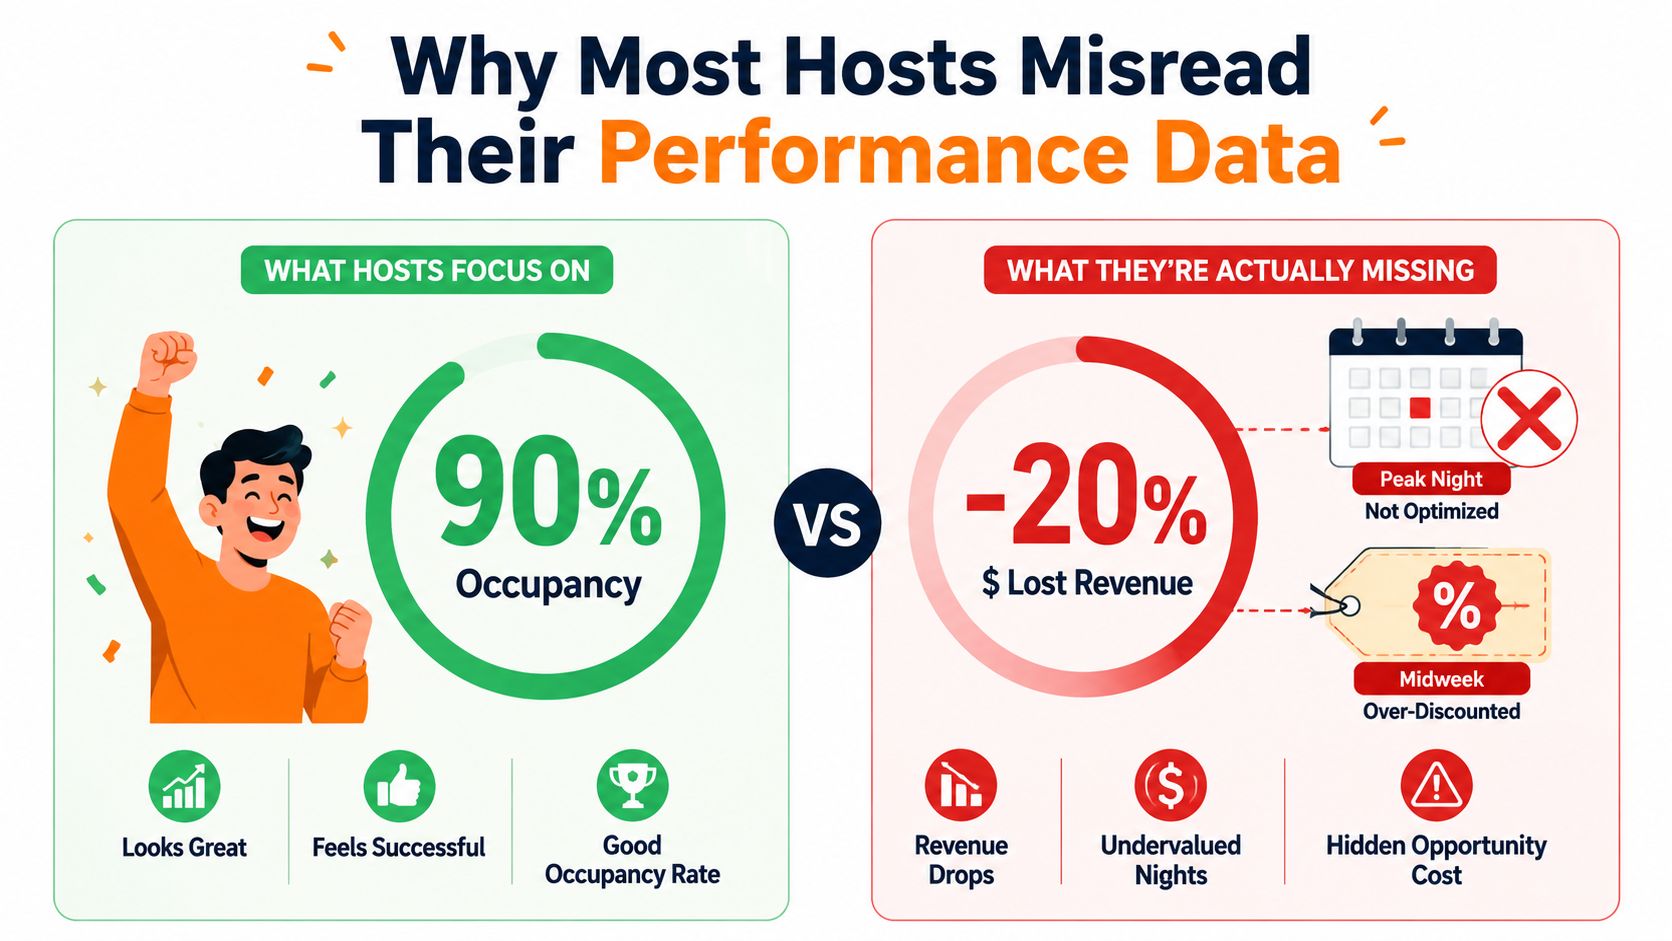
The common mistake is optimizing one metric in isolation. Chasing bookings at any price can compress ADR, create more turnovers, and leave less room for maintenance or guest-service costs. Pushing ADR without watching booking pace can produce a beautiful rate report and an empty future calendar.
Replace the scoreboard with decisions
I treat short term rental analytics as an operating system, not a retrospective report. Every number should answer a question:
- Should I raise the rate? Check booking pace, comparable pricing, and the remaining demand for that date.
- Should I accept this reservation? Consider the stay length, orphan-night risk, cleaning burden, and opportunity cost of the dates.
- Should I loosen the minimum stay? Look for recurring calendar gaps and compare them with actual length-of-stay behavior.
- Should I discount? Identify whether the weakness is a price problem, a channel problem, or a listing-position problem first.
A property with lower occupancy at a stronger rate can outperform a fuller property with compressed pricing. That's why the right comparison combines occupancy, ADR, and RevPAR rather than celebrating a single headline figure. Data Hunters Agency's analytics guide is useful background for building reporting habits, but hosts still need to connect each report to a concrete calendar or operating decision.
Read performance in context
Availability also changes the meaning of occupancy. A host who blocks personal-use dates, holds maintenance nights, or applies strict minimum stays is measuring a different supply base from a host who opens every night. Before comparing properties, define what counts as available and keep that definition consistent.
The same discipline applies to operations. Pair revenue metrics with the practical measures covered in this operational efficiency metrics guide, including response workload, turnover pressure, and service friction. A dashboard that reports what happened but never changes a rate, rule, message, or staffing decision is dashboard clutter.
Practical rule: Never ask whether occupancy is “good” until you know what rate produced it, which dates sold, and what the bookings cost to service.
Core Revenue Metrics Every Host Must Track Together
Three KPIs form the core of most short term rental analytics systems: occupancy rate, ADR, and RevPAR. Add length of stay, and you can see how pricing, demand capture, and calendar structure interact.
AirDNA's KPI explanation defines occupancy as demand divided by supply, ADR as total revenue divided by booked nights, and RevPAR as ADR multiplied by occupancy. In practical terms, occupancy measures demand capture, ADR shows pricing power, and RevPAR shows how efficiently the available calendar generated revenue.
The four numbers and the mistake behind each
Occupancy rate equals booked nights divided by available nights. It reveals whether guests are choosing the property, but it doesn't tell you whether the price was sensible. A host can improve occupancy by discounting, while weakening the value of every booked night.
ADR, or average daily rate, equals total accommodation revenue divided by booked nights. ADR shows what guests paid on average, but a high ADR achieved through aggressive pricing can reduce booking pace and create expensive gaps.
RevPAR, or revenue per available rental night, equals ADR multiplied by occupancy, using occupancy as a decimal in the calculation. Because it incorporates both rate and calendar utilization, RevPAR is usually the cleanest yield measure. It still needs cost context, since a booking with heavy turnover or service requirements can have weaker net value than the headline RevPAR suggests.
Length of stay, or LOS, equals booked nights divided by reservations. LOS exposes the effect of minimum-stay settings, discounts, and guest mix. Longer stays can reduce turnover frequency, but they can also block premium dates or force you to accept a lower effective rate across an attractive period.
The table below uses hypothetical profiles to show why identical revenue can conceal different operating realities. The figures are illustrative, not market benchmarks.
| Metric | Listing A, High ADR | Listing B, Balanced | Listing C, High Occupancy |
|---|---|---|---|
| Monthly revenue | USD 12,000 | USD 12,000 | USD 12,000 |
| Booked nights | 15 | 20 | 27 |
| ADR | USD 800 | USD 600 | USD 444.44 |
| Available nights | 30 | 30 | 30 |
| Occupancy rate | 50% | 66.67% | 90% |
| RevPAR | USD 400 | USD 400 | USD 400 |
| Operational profile | Fewer turns, more vacant nights | Middle path | Fuller calendar, lower nightly yield |
The profiles reach the same RevPAR because the revenue and available-night base are identical, but they create different risks. Listing A depends on strong pricing power and can suffer from long vacancies. Listing C may generate more guest-service work and leave less room to capture premium demand.
A weekly revenue report can help keep these measures visible without forcing the host to reconstruct performance from separate calendars. For a fuller revenue-management routine, pair the figures with the workflow in this vacation rental revenue management resource. Review the four metrics together, then make one controlled change rather than moving every setting at once.
Behavioral Metrics That Reveal Guest Booking Patterns
Core KPIs tell you what happened. Behavioral metrics explain how guests reached that outcome, which makes them more useful for changing future availability and pricing.
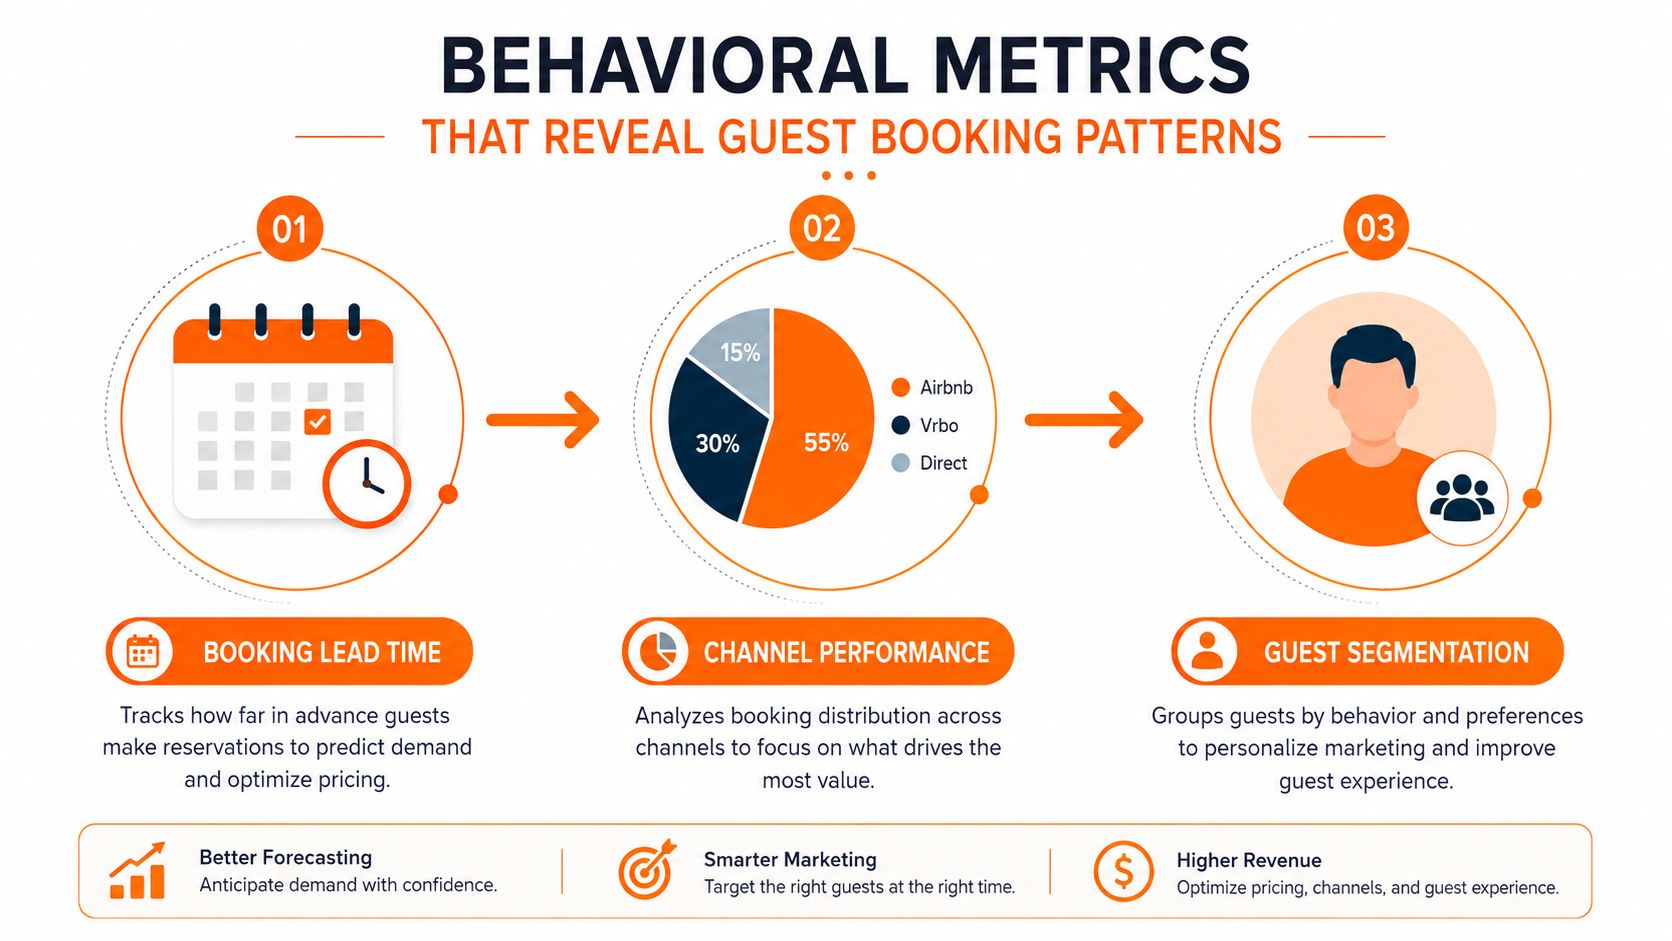
Booking lead time is the first place to look. Record the number of days between reservation and arrival, then segment the results instead of relying on one average. A property with a mix of early planners and last-minute bookers needs different pricing rules for those demand groups.
The U.S. vacation rental market showed a 3% decline in average booking window, to 22.3 days, alongside nearly 10% growth in average length of stay, to 4.42 nights, in 2025, according to The Host Report. The practical implication isn't to copy a market average. It's to examine whether your own calendar is filling later while stays are becoming longer, then adjust rules around those patterns.
Turn segments into calendar rules
Start with three cuts:
- Lead time: Compare early planners, mid-window shoppers, and last-minute demand. Hold firm on dates that historically book early, then use targeted reductions only when the remaining window shows weak pace.
- Length of stay: Separate short breaks, standard stays, and extended bookings. Longer stays may justify a different cleaning-fee strategy, while short stays can require stricter margins.
- Arrival pattern: Identify guests who favor weekends, weekdays, or particular check-in days. Use that information to decide whether a check-in restriction is protecting the calendar or blocking useful demand.
Channel analysis needs the same discipline. Compare Airbnb, Vrbo, direct bookings, and other sources by net revenue after fees, cancellation behavior, lead time, LOS, and support workload. A channel that supplies volume but attracts short, high-maintenance reservations may be less valuable than a quieter channel with longer stays and fewer service issues.
Guest segmentation should also influence messaging. Last-minute bookers may respond to a clear availability message and a focused offer, while longer-stay guests need practical information about Wi-Fi, laundry, parking, and local services before arrival. Track the booking source and guest persona with consistent tags, not free-form notes that can't be filtered later.
The useful segment isn't “all guests.” It's the group whose behavior changes a specific pricing or availability decision.
Building a Reliable Data Collection Workflow
Most reconciliation problems begin before analysis. Airbnb dashboards, Vrbo exports, PMS reports, payment processors, and spreadsheets often use different definitions for revenue, booked nights, blocked dates, taxes, refunds, and fees. If those definitions aren't documented, the dashboard can be precise and still be wrong.
Use a single reservation record as the operational foundation. Each record should carry the property, channel, reservation dates, booking date, gross revenue, fees, taxes, cleaning revenue, status, cancellation details, and a consistent source tag. Keep operating costs in a separate but joinable table so you can move from gross booking value to net contribution without editing reservation rows manually.
Automate the stable inputs
Real-time or frequent synchronization suits data that changes the calendar:
- Reservations and cancellations: Pull from channel connections or the PMS so availability and revenue stay aligned.
- Calendar blocks: Record owner stays, maintenance, and unavailable nights with explicit reasons.
- Pricing changes: Preserve rate updates when possible, so you can later compare price decisions with booking pace.
Weekly batch work is better for information that supports interpretation rather than immediate action. Review scores, competitor rate checks, and market observations can be added on a fixed schedule. Monthly audits should cover refunds, chargebacks, direct-booking attribution, and unmatched transactions.
Manual tagging still has a place. Acquisition source, guest purpose, maintenance cause, and service recovery reason often need human judgment. The mistake is allowing every team member to invent a different label.
Match the workflow to the portfolio
A single-property host can start with a well-designed Google Sheet, native channel exports, and a weekly reconciliation. A growing operator may need a PMS with channel management, automated exports, and a reporting layer such as Looker Studio. Larger teams can add a warehouse, defined data models, and role-based dashboards, but complexity should follow decision volume.
Zapier or Make.com can connect practical triggers without turning the business into a software project. Examples include a new reservation creating a standardized row, a cancellation flagging an availability review, or a completed stay prompting a review-request and service-tag workflow. Test every automation against refunds, date changes, duplicate records, and cancelled reservations before trusting the output.
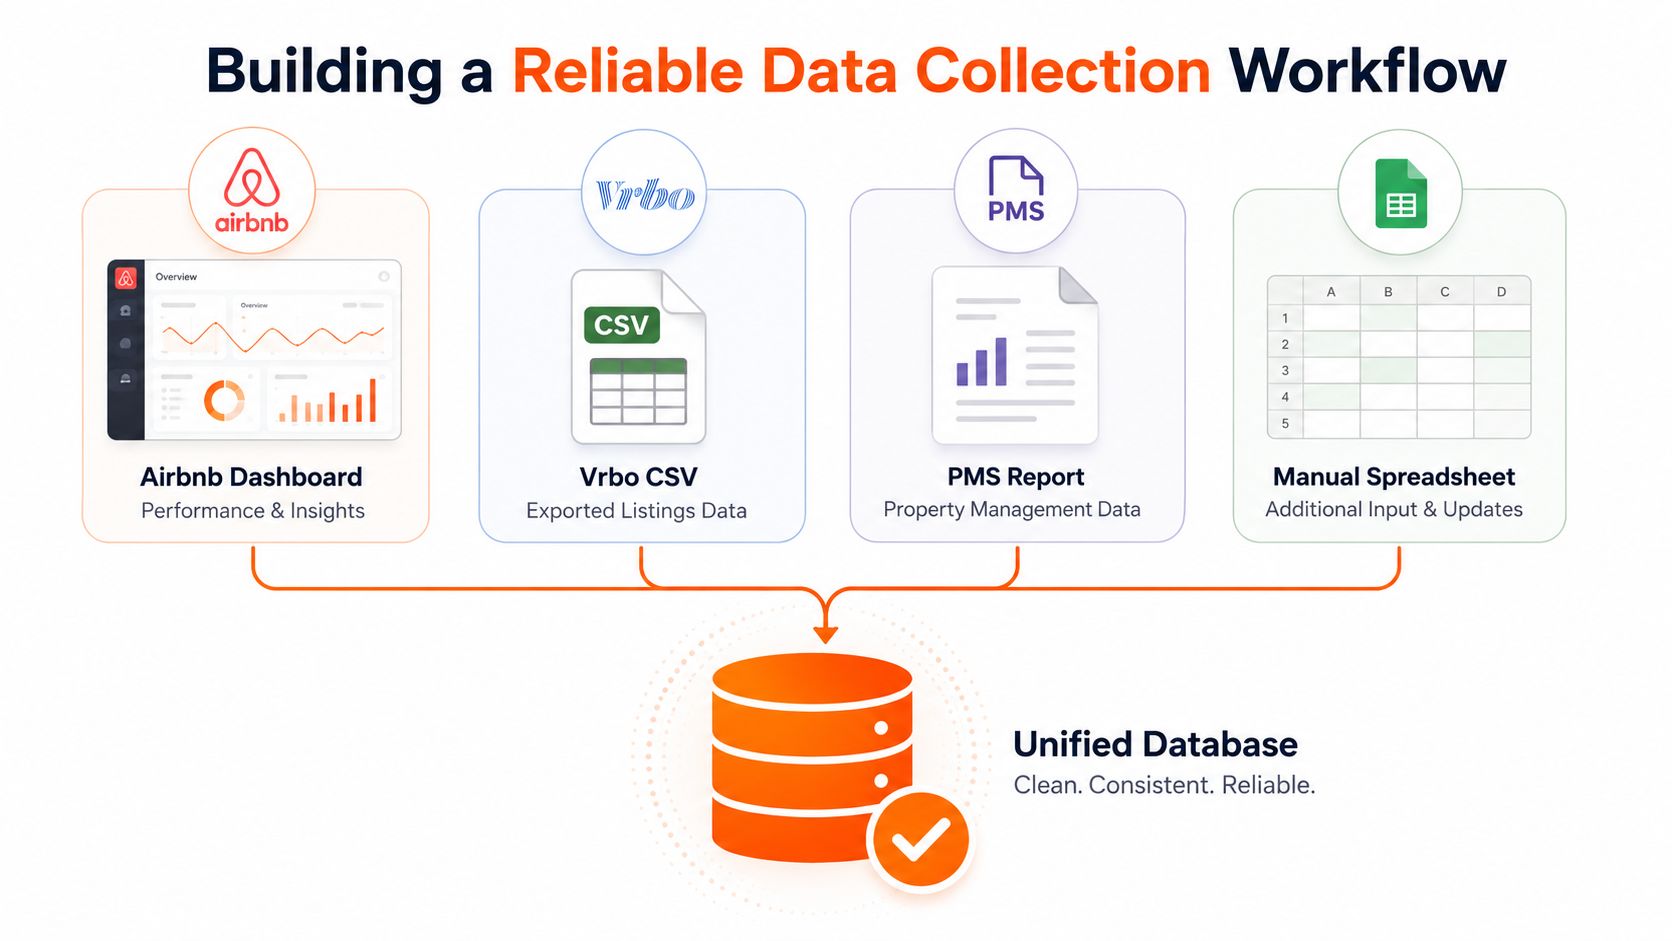
A visual explanation of the data flow can help teams agree on ownership and definitions:
The best workflow is not the one with the most integrations. It's the one that lets you trust the number, trace its origin, and act without rebuilding the dataset by hand.
Designing Dashboards for Single and Multi-Property Portfolios
A single-property dashboard should feel like a cockpit. A portfolio dashboard should feel like an exception queue. Combining both creates noise, because the owner of one listing needs immediate calendar decisions while a manager needs to know which property deserves attention first.
For one property, keep the daily view narrow. Show current availability, upcoming arrivals, booking pace, recent rate changes, open calendar gaps, and a forward revenue view. Add operational signals such as unresolved guest issues, review themes, and upcoming maintenance. The dashboard should tell you what to do today, not display every historical data point.
A multi-property operator needs aggregation and drill-down. Start with portfolio revenue, occupancy, ADR, RevPAR, channel mix, cancellations, and service workload. Then flag outliers by property, rather than forcing the manager to inspect every listing manually.
| KPI Category | Single-Property View | Multi-Property View | Recommended Visualization |
|---|---|---|---|
| Demand | Upcoming booked nights and booking pace | Property ranking and outlier detection | Sparklines |
| Pricing | Next available dates and rate changes | ADR and RevPAR comparison by property | Heatmap or comparison bars |
| Calendar | Orphan nights and minimum-stay conflicts | Availability gaps across the portfolio | Calendar heatmap |
| Revenue | Forward revenue and net contribution | Revenue attribution by property and channel | Waterfall chart |
| Guest operations | Arrivals, issues, review themes | Cancellation and support exceptions | Alert list |
Build alerts that earn attention
An alert should trigger a decision. “Occupancy changed” is rarely enough. “A listing is pacing below its own comparable period,” “a cancellation needs replacement demand,” or “a channel's net contribution has weakened” gives the operator a reason to investigate.
Use sparklines for direction, heatmaps for day-of-week patterns, and waterfall charts for the movement from gross revenue to fees, refunds, and net income. Hosts who want a practical starting point can review these 2025 analytics report examples for layout ideas, then remove anything that doesn't lead to an action.
A Google Sheet is enough for a small operation if the definitions are consistent. Looker Studio works when several data sources need a shared visual layer. Tableau becomes more useful when the portfolio has complex filtering and multiple audiences. The underlying structure matters more than the brand of dashboard software.
For operational visibility, this property management dashboard guide can help connect performance reporting with the guest and team workflows that produce it.
Advanced Analytics Techniques Worth the Investment
Advanced analytics earns its place only when it changes a decision that basic reporting can't answer. A model that produces an interesting forecast but never changes a rate, channel allocation, amenity investment, or staffing plan is an expensive distraction.
Cohort analysis is usually the most practical next step for hosts with direct-booking activity. Group guests by acquisition period, campaign, booking source, or first-stay season, then compare their later behavior. The questions are concrete: Which source brings repeat guests? Which campaign produces longer stays? Which guest group generates service requests that erase its apparent value?
The method becomes less useful when every reservation is one-off and the host has no repeat-booking channel. In that situation, improve source tagging and guest communication first.
Test pricing instead of guessing
A/B testing can provide stronger evidence than a market summary. Use similar dates or comparable units, define one pricing variable, and keep the test controlled. Possible variables include a base rate, a last-minute rule, a minimum stay, or a discount structure.
The decision must be stated before the test starts. For example, you might ask whether a lower base rate increases net RevPAR enough to justify the lost ADR. Record booking pace, occupancy, ADR, RevPAR, LOS, cancellations, and channel mix, then account for unusual demand such as an event or weather disruption.
Regression analysis can help isolate how listing features relate to ADR, but it needs consistent property records and enough comparable observations to avoid false conclusions. It's more defensible for an operator managing a meaningful portfolio than for a host trying to explain one season of one home.
Attribution modeling has a similar boundary. If you spend on paid advertising across several touchpoints, attribution can help allocate budget. If bookings arrive organically through one platform, a complex model adds administration without improving the decision.
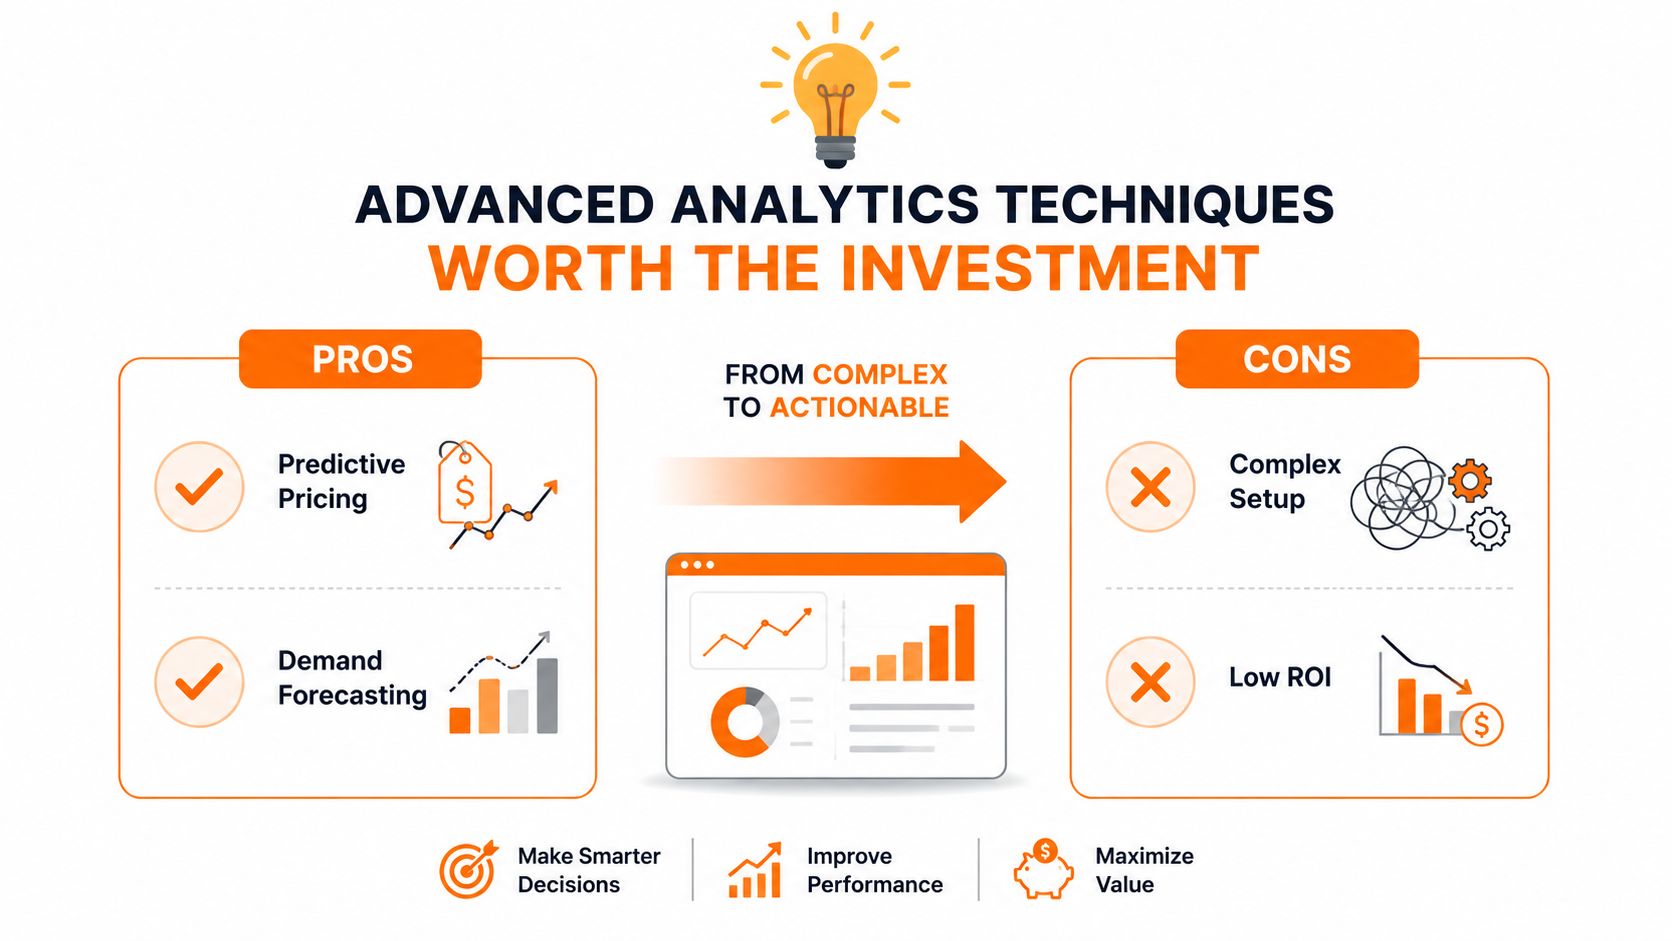
Choose complexity by decision value
The useful progression is simple:
- Reliable KPI definitions: Fix data quality before adding models.
- Segmented reporting: Separate channel, lead time, LOS, and property type.
- Controlled experiments: Test a change where the result can guide action.
- Predictive methods: Add forecasting when the operational payoff justifies maintenance.
Market context can also guide investment choices. AirDNA's 2026 outlook projects U.S. occupancy at 57.4%, above the pre-pandemic average of 57.0%, with demand and available listings both projected to grow 2.7%, while its outlook describes slower new-listing growth as supportive of established operators and pricing, as reported by Yahoo Finance's coverage. Those projections are useful context, but your own booking pace and net contribution should decide what you do with them.
Action Plans and Quick Wins You Can Implement This Week
Start with the smallest system that can change your calendar. A single-property host doesn't need a data warehouse on the first day. A portfolio manager shouldn't rely on a manually edited sheet once exceptions are arriving faster than the team can review them.
For a single property
Begin with a five-part routine:
- Audit ADR against a true comp set. Match property type, capacity, quality, and location. Remove dates where your rate is clearly disconnected from demand, but don't reduce prices without checking booking pace.
- Segment lead time and LOS. Use the result to vary minimum stays and last-minute pricing. Protect dates that book early, and make isolated gaps easier to reserve when the pattern supports it.
- Review weekly. Spend a short, fixed period checking occupancy, ADR, RevPAR, forward revenue, open gaps, and recent booking behavior.
- Run one shoulder-season experiment. Change one variable, such as the base rate or minimum stay, and record the result.
- Audit net revenue. Include channel fees, refunds, cleaning costs, and other direct booking expenses before deciding that a promotion worked.
For a multi-property operator
Portfolio managers should add channel attribution, repeat versus first-time guest cohorts, and automated exception alerts. Rank properties by RevPAR and net contribution, then inspect the weakest outliers rather than applying one pricing rule everywhere. The same approach identifies channel imbalance, cancellation clusters, and recurring operational failures.
| Action Item | Host Type | Time Investment | Primary KPI Impacted | Expected Timeline |
|---|---|---|---|---|
| Find and price orphan-night gaps | Any host | Short setup, then weekly review | Occupancy and RevPAR | Near-term calendar response |
| Adjust check-in restrictions by LOS | Single property or small portfolio | Moderate analysis | LOS and occupancy | After enough new booking behavior is observed |
| Remove a weak OTA after net review | Multi-channel operator | One reconciliation cycle | Net revenue and channel mix | Following future booking activity |
| Add automated cancellation alerts | Multi-property operator | Moderate setup | Occupancy and booking pace | After the workflow is tested |
| Tag guest source and purpose | Any host | Small ongoing habit | Attribution and LOS | As new reservations accumulate |
Three quick wins are especially practical. First, tighten isolated gaps with targeted last-minute discounts instead of discounting the entire calendar. Second, change check-in day restrictions when your LOS pattern shows they're blocking otherwise useful stays. Third, stop feeding an OTA that consumes commission and attention without producing worthwhile net bookings.
A simple maturity roadmap keeps the work manageable:
- First 30 days: Standardize definitions, reconcile sources, and track occupancy, ADR, RevPAR, LOS, lead time, and net revenue.
- By 60 days: Segment results by channel, arrival pattern, stay length, and booking window. Add a weekly decision review.
- By 90 days: Automate recurring data collection, establish exception alerts, and run a controlled pricing or minimum-stay test.
The operator's advantage doesn't come from displaying more metrics. It comes from noticing a pattern early, making one deliberate change, and checking whether the next booking cycle validates that decision.
ScanStay helps hosts turn guest-service activity into usable operational insight through a digital welcome book with scan analytics, page views, guest questions, and service browsing data, while also centralizing Wi-Fi, arrival instructions, house rules, recommendations, and upsells. Visit ScanStay to connect guest experience data with the revenue and workflow decisions in your short term rental analytics routine.