Airbnb Analytics for Hosts: Boost Bookings & Revenue 2026
Unlock Airbnb analytics for hosts. Interpret metrics, run smart tests & use data to boost bookings and revenue in 2026.
You open your calendar, see a patch of empty nights, and start making random moves. You trim the rate for a weekend. Swap the cover photo. Rewrite the first sentence of the description. Then you wait, hoping one of those changes fixes the problem.
That's how many hosts operate at first. The listing feels active, but the decisions are reactive. One week you think pricing is the issue. The next week you blame seasonality. Then a booking comes in and it's easy to assume the last tweak worked, even if demand shifted on its own.
Good hosting gets much easier when you stop treating performance like a mystery. Airbnb analytics for hosts give you a way to separate visibility problems from pricing problems, and booking problems from guest-experience problems. Once you read the signals correctly, you can make smaller changes with more confidence, protect your rates, reduce support friction, and build a better review profile at the same time.
Table of Contents
- Stop Guessing and Start Measuring Your Success
- Your Guide to the Airbnb Insights Tab
- Interpreting Your Listing's Performance Story
- Running Smart Experiments to Boost Bookings
- Beyond Bookings with Guest Experience Analytics
- Frequently Asked Questions About Airbnb Analytics
Stop Guessing and Start Measuring Your Success
You open your calendar on Tuesday and spot a gap for next weekend. Bookings feel slow, so the first instinct is to drop the rate. Many hosts do that. It often treats the wrong problem.
A clean, well-located home can still underperform if too few guests click the listing, if the photos do not match the price point, or if guests book and then hit friction during the stay. I see hosts focus on one half of the business and miss the other. They chase pre-booking numbers like views and conversion, then ignore message volume, check-in confusion, and review patterns that shape future demand. Strong Airbnb analytics for hosts connects both sides. First you measure how guests find and book the property. Then you measure what happens after arrival, because in-stay performance affects reviews, pricing power, and repeat bookings.
That shift changes the questions you ask.
Instead of asking why the listing feels off, ask where the bottleneck sits. Are impressions low because your market position is weak? Are clicks healthy but bookings soft because price, fees, or minimum stay are out of line? Are bookings coming in, but operations issues are creating the kind of guest experience that drags down ratings and future conversion?
Airbnb's business scale is large enough that small listing mistakes can get buried fast in a crowded market. In its 2024 annual results, Airbnb reported 491 million nights and experiences booked and about $81.8 billion in gross booking value, according to the company's investor reporting in its Airbnb annual results and shareholder materials. Hosts do not need enterprise-level reporting to compete, but they do need a measurement habit.
One practical exercise is to study high-performing listings in your market and nearby vacation markets with similar guest expectations. Look at photo order, amenity packaging, bedroom setup, and how the value proposition is framed before the guest even considers the nightly rate. If you want a benchmark for polished presentation, View Dream Destin luxury properties and compare how professionally managed homes package space, features, and trip appeal.
Practical rule: Don't change three things because bookings slowed. Find the bottleneck first. Then change one variable that matches it.
That discipline protects revenue on the front end and improves guest experience on the back end. It also makes your results easier to explain, which is how hosts stop guessing and start managing their listing like a business.
Your Guide to the Airbnb Insights Tab
The first useful lesson in Airbnb analytics for hosts is simple. If you don't know where the data lives, you won't build a habit around it.
Where to find the data
Start in your host account, not in your inbox and not in your calendar. Airbnb's own workflow is straightforward: go to your Hosting dashboard, open the upper-right menu, choose Insights, then scroll to the Conversions area to see the key graphs that help you evaluate how your listing is performing (Airbnb's guide to host insights).
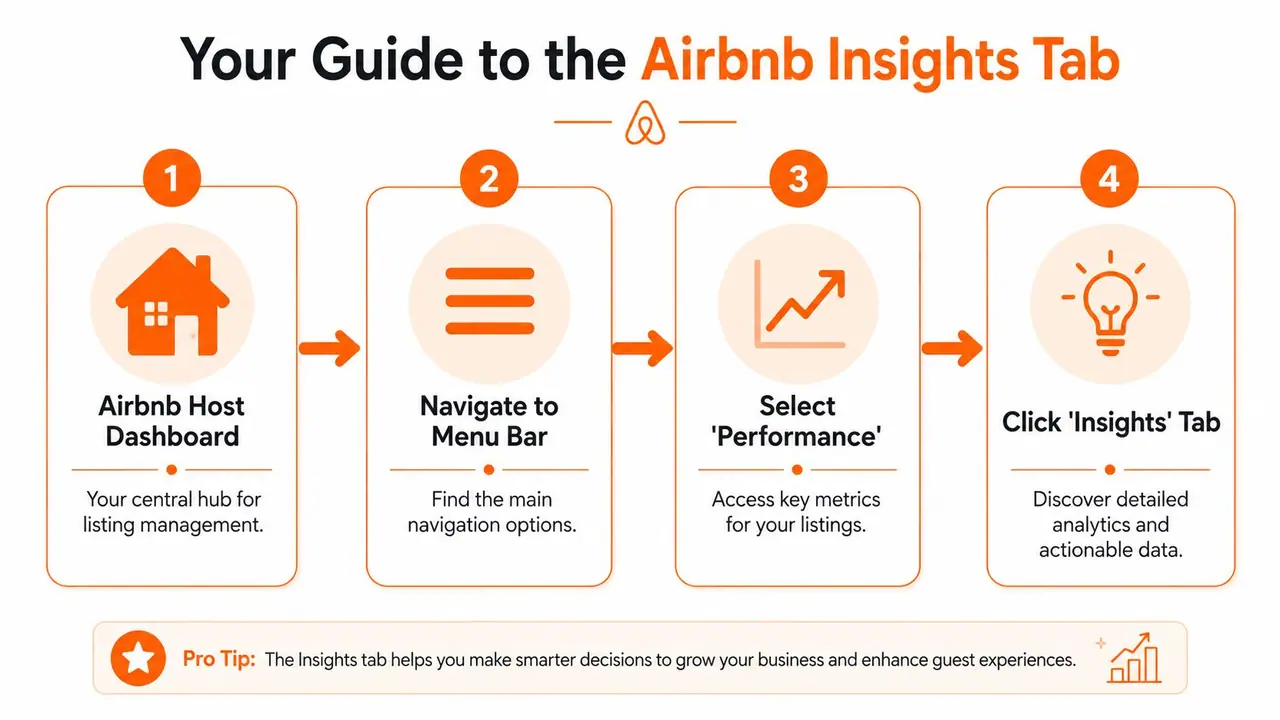
If you prefer to see the navigation in action before clicking around yourself, this walkthrough helps:
Most hosts don't need more dashboards. They need one dashboard they consistently check. Airbnb's Insights tab is good enough to create that routine.
What the core metrics actually mean
A lot of confusion comes from reading labels without understanding the decision behind them. Here's the plain-English version of the metrics that matter most.
| Metric | What it tells you | What to do with it |
|---|---|---|
| Views | How many shoppers are landing on the listing | Low views usually point to a visibility problem |
| Conversion rate | How often listing interest turns into reservations | Weak conversion suggests pricing, photos, reviews, or fit |
| Occupancy rate | How many available nights are actually booked | Helps judge whether demand and pricing are aligned |
| ADR | Average daily rate per booked night | Shows whether you're capturing value, not just filling nights |
| RevPAR | Revenue across all available nights | Combines pricing and occupancy into one practical score |
| Wishlist additions | A softer intent signal from shoppers | Useful when interest is building before bookings arrive |
| ALOS | Average length of stay | Helps you spot whether your stay rules match guest behavior |
Airbnb also surfaces KPI categories such as occupancy rate, ADR, RevPAR, ALOS, reservation conversion rate, returning visitor rate, and wishlist additions, which gives hosts a more complete operating view than a simple booking count.
If you only track booked nights, you'll miss the stage where the listing actually starts underperforming.
The point isn't to become a spreadsheet person. The point is to know which number explains the problem in front of you. Once that clicks, the dashboard stops feeling technical and starts feeling useful.
Interpreting Your Listing's Performance Story
A dashboard doesn't tell the truth on its own. Hosts have to interpret it in sequence. The easiest way to do that is to read the guest journey from top to bottom.

Read bottlenecks in the right order
If views are low, start with search visibility. Your title may be too generic. Your amenity setup may not match key filters guests use. Your price may be out of line for the search result page, which suppresses click opportunity before the guest even evaluates the listing.
If views are healthy but conversion is weak, the issue usually sits on the listing page itself. That's where guests compare photo quality, value, fees, review confidence, bed setup, and cancellation terms. Don't answer a conversion problem with a visibility fix.
If conversion is acceptable but occupancy still lags, look at pacing and stay restrictions. Minimum-night rules, blocked dates, check-in limitations, and slow response to softer periods can leave money on the table even when the listing is attractive.
A simple diagnostic flow looks like this:
- Low traffic first: Check search-facing elements such as pricing position, main photo, title clarity, and amenity filters.
- Weak page performance second: Review the first five photos, headline promise, review themes, and whether the rate matches the perceived value.
- Booking pattern third: Examine calendar rules, weekday gaps, and whether you're reacting to future demand early enough.
Strong hosts don't ask whether the listing is “good.” They ask where the funnel breaks.
Use time comparisons without fooling yourself
Airbnb's host tools let you compare performance across the last year, last month, and last week, and preview demand for the next week, next month, next 3 months, and next 6 months. The platform also says hosts can track historical, future, and real-time performance and compare results against a competitive set of similar listings. That matters because comparison in isolation can mislead you qualitatively even when the raw chart looks dramatic.
For example, a bad week may be nothing more than a marketwide soft patch. A strong month may reflect a holiday pulse you didn't create. Use the previous-period view and the comp set together or you risk rewarding the wrong change.
Here's the interpretation rule I use:
- Compare against your own history to find shifts.
- Compare against similar listings to see whether the shift is yours or the market's.
- Check future demand windows before adjusting aggressively.
- Only then make the operational move.
If you want a broader framework for reading vacation rental performance across visibility, revenue, and booking pace, this guide to vacation rental analytics is a strong companion.
The biggest win from this habit isn't perfect forecasting. It's avoiding bad reactions. Hosts lose more money from misreading a dip than from the dip itself.
Running Smart Experiments to Boost Bookings
Once you know the likely bottleneck, the next move isn't a redesign. It's a test.
Too many hosts edit the title, change the first photo, drop the price, and rewrite house rules in the same week. Then they get a booking and can't tell what caused it. That's not optimization. That's noise.
Start with a single hypothesis
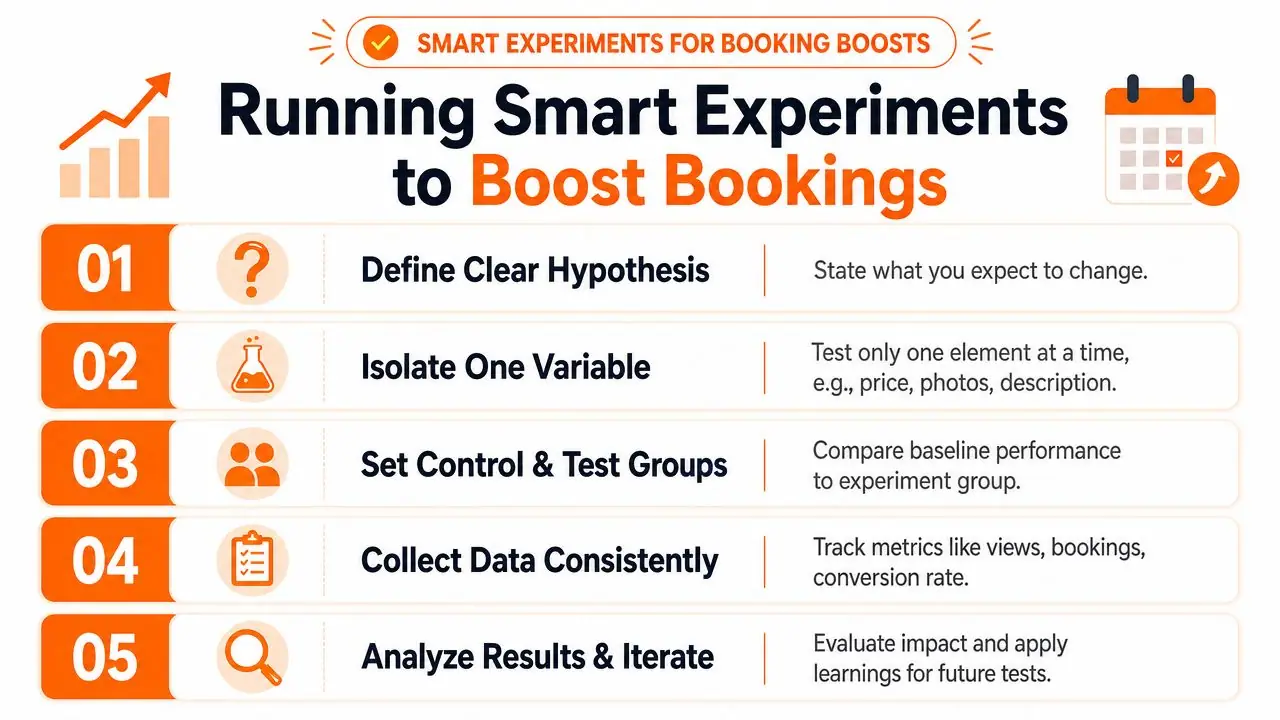
A useful experiment starts with one sentence: I think changing X will improve Y because Z.
Examples:
- Pricing test: I think a tighter base rate will improve search visibility because the listing is priced above close substitutes.
- Photo test: I think replacing the hero image will improve click quality because the current first image hides the best feature.
- Copy test: I think a clearer title will improve conversion because guests don't immediately understand who the property is for.
Then keep the test clean.
- Pick one variable.
- Leave everything else alone.
- Watch the same metric throughout the test window.
- Write down the result before changing anything else.
This is the same mindset behind any solid booking-growth process. If you want a practical host-side framework, this guide on how to increase Airbnb bookings fits well with that approach.
Test pricing visibility before chasing occupancy
One of the most useful visibility signals is First Page Impression Rate. Industry guidance cited by PriceLabs says successful hosts often maintain a first-page impression rate between 40% and 60%, and that hosts using dynamic pricing strategies see a 25% improvement in conversion rates compared to fixed rates (PriceLabs on Airbnb analytics and visibility).
That doesn't mean “lower your price until something happens.” It means test whether your listing is positioned to appear where guests shop.
Try this sequence:
- Adjust your base price carefully: Move the listing into a more competitive search band rather than making a panic discount.
- Watch visibility first: If impressions improve, the market may have been telling you the listing was overpriced for discovery.
- Only then judge conversion: More traffic with no booking lift means the problem sits elsewhere.
Field note: Price cuts solve the wrong problem when the listing page fails to justify the rate.
What to test after pricing
Photos are the next lever I'd touch. Most hosts have decent photo sets and weak photo order. The first handful of images carry the burden.
Focus on:
- Hero image quality: Lead with the image that explains the stay fastest.
- Second and third photos: These often decide whether a guest keeps browsing or bounces.
- Caption alignment: Make sure the sequence matches the promise in your title.
Then test copy.
A stronger title doesn't need to sound clever. It needs to sound specific. A guest should know whether the property is a beach base, work-friendly condo, family setup, or quick weekend retreat.
Keep your experiments boring and traceable. That's what makes them profitable.
Beyond Bookings with Guest Experience Analytics
Most Airbnb analytics for hosts stop at the reservation. That's useful, but incomplete. The guest doesn't stop generating operational signals after they book, and many review problems begin after the checkout date is already secured.
The missing half of performance data
Mainstream hosting analytics tend to focus on ADR, occupancy, and market demand, while giving far less attention to whether your data can predict support load, review quality, or upsell conversion from guest-facing information. That blind spot becomes more obvious when you manage contactless check-ins, guests arriving late, multilingual communication, and repetitive pre-arrival questions.
A listing can look healthy in pre-booking metrics and still run poorly in real life. You see it when guests ask the same Wi-Fi question every week, struggle to find parking instructions, miss house rules, or leave good-but-not-great reviews because check-in felt harder than it should have.

What to track during the stay
In-stay analytics are simpler than they sound. You're looking for friction patterns.
A practical guest-experience dataset includes:
- Information demand: Which guest instructions get accessed most often, such as check-in steps, Wi-Fi, parking, trash, or checkout.
- Support hotspots: Which topics still trigger messages even though you already provided the information.
- Timing patterns: When guests typically need help, such as arrival hour, first morning, or pre-checkout.
- Content gaps: Which house details guests consistently miss, signaling that the wording or placement is weak.
This is also where property access matters. For hosts managing gates or controlled-entry communities, it helps to pair communication clarity with operational tools such as secure gate management features so access issues don't spill into guest messaging and review sentiment.
Guests usually don't complain that your system lacked sophistication. They complain because they couldn't find what they needed in time.
If you want a deeper operational lens on this side of hosting, this resource on how to improve guest satisfaction is worth reading.
How operations data supports revenue too
Guest analytics aren't just defensive. They can support revenue when you use them carefully.
For example, if guests repeatedly check local transport instructions, that tells you transfers may be relevant. If late-night arrivals consistently access checkout details early, late checkout or luggage support may be worth testing. If local recommendations get heavy use, your neighborhood guide is doing real work and can be expanded to reduce “What should we do?” messages.
The key trade-off is this: hosts often spend enormous time perfecting rate strategy while ignoring the systems that shape guest confidence after booking. That's backwards. Better guest information reduces friction, protects reviews, and can uncover extra revenue opportunities that don't require changing the nightly rate at all.
Pre-booking analytics help you win the reservation. In-stay analytics help you deliver on the promise. The strongest operations treat both as one performance system.
Frequently Asked Questions About Airbnb Analytics
How often should hosts check analytics
Check your data lightly each week and think more thoroughly once a month. Weekly reviews catch sudden changes in traffic, conversion, and booking pace before they grow into a real calendar problem. Monthly reviews are better for decisions that shouldn't swing around, like pricing structure, stay rules, photo order, and market positioning.
If you check too often, you'll react to noise. If you check too rarely, you'll miss patterns.
What is a good Airbnb conversion rate
The host benchmark often referenced in practice is 1% to 5%, with stronger listings sitting toward the top of that range. But “good” depends on context. A highly seasonal market, luxury inventory, unusual stay minimums, or a niche property can all shift what healthy conversion looks like.
Don't judge conversion alone. Pair it with traffic quality and rate strategy. A listing with modest conversion and strong ADR can outperform a listing that converts better at a weaker price point.
Can you trust similar listings data
Use it, but don't worship it. Similar listing sets are helpful for context, especially when your traffic suddenly dips or spikes. They're less helpful when you assume Airbnb's comparison group matches your true competitors perfectly.
Build your own mental comp set. Look for nearby listings with similar bedroom count, amenity tier, guest expectations, and review profile. That keeps you grounded when platform comparisons feel too broad.
Should small hosts use dynamic pricing
Usually, yes, if they set guardrails and review outcomes. Fixed pricing is easy, but it rarely keeps up with local shifts in demand and visibility. This matters in a large market. Airbnb had about 8.1 million listings worldwide in 2024, operated by roughly 5 million hosts, and one 2025 industry estimate put the U.S. average short-term rental occupancy rate at about 50–54%, which shows how uneven results can be across markets (Business of Apps Airbnb statistics).
Dynamic pricing doesn't remove judgment. It gives you a faster way to respond while you keep control of floors, ceilings, and strategy.
What should a new host focus on first
Start with the smallest useful set of metrics:
- Visibility: Are people finding the listing?
- Conversion: Are shoppers turning into bookings?
- Occupancy: Are available nights filling at a healthy pace?
- Guest friction: What questions keep repeating after booking?
That sequence keeps you from solving the wrong problem. Strong hosting is rarely about one magic metric. It's about knowing which metric deserves your attention today.
If you want a cleaner way to connect guest communication with operational insight, ScanStay helps hosts replace scattered messages and paper binders with a mobile-friendly digital welcome book. Guests get instant access to Wi-Fi, check-in details, house rules, local recommendations, and upsell options through one QR code, while hosts gain a clearer view of what guests use during the stay.